
Page 25 - BH-2-1
P. 25
Brain & Heart Pictorial rendition pulmonary stenosis
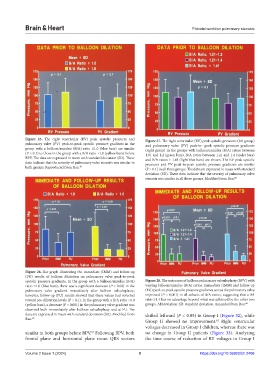
Figure 25. The right ventricular (RV) peak systolic pressures and Figure 27. The right ventricular (RV) peak systolic pressures (left group)
pulmonary valve (PV) peak-to-peak systolic pressure gradients in the and pulmonary valve (PV) peak-to- peak systolic pressure gradients
group with a balloon/annulus (B/A) ratio ≤1.0 (blue bars) are similar (right group) in the groups with balloon/annulus (B/A) ratios between
(P > 0.1) to those in the group with a B/A ratio >1.0 (yellow bars) before 1.01 and 1.2 (green bars), B/A ratios between 1.21 and 1.4 (violet bars)
BPV. The data are expressed in mean with standard deviation (SD). These and B/A ratios ≥ 1.41 (light blue bars) are shown. The RV peak systolic
data indicate that the severity of pulmonary valve stenosis was similar in pressures and PV peak-to-peak systolic pressure gradients are similar
both groups. Reproduced from Rao. 48 (P > 0.1) in all three groups. The data are expressed in mean with standard
deviation (SD). These data indicate that the severity of pulmonary valve
stenosis was similar in all three groups. Modified from Rao. 60
Figure 26. Bar graph illustrating the immediate (IMM) and follow-up
(FU) results of balloon dilatation on pulmonary valve peak-to-peak
systolic pressure gradients. In the group with a balloon/annulus (B/A) Figure 28. The outcomes of balloon pulmonary valvuloplasty (BPV) with
ratio ≤1.0 (blue bars), there was a significant decrease (P < 0.02) in the varying balloon/annulus (B/A) ratios. Immediate (IMM) and follow-up
pulmonary valve gradient immediately after balloon valvuloplasty; (FU) peak-to-peak systolic pressure gradients across the pulmonary valve
however, follow-up (FU) results showed that these values had reverted improved (P < 0.001) in all subsets of B/A ratios, suggesting that a BA
toward pre-dilatation levels (P > 0.1). In the group with a B/A ratio >1.0 ratio ≥1.4 has no advantage beyond what was achieved by the other two
(yellow bars), a decrease (P < 0.001) in the pulmonary valve gradient was groups. Abbreviation: SD: standard deviation. Amended from Rao. 60
observed both immediately after balloon valvuloplasty and at FU. The
data are expressed in mean with standard deviation (SD). Modified from shifted leftward (P < 0.05) in Group I (Figure 32), while
Rao. 60
Group II showed no improvement. Right ventricular
62
voltages decreased in Group I children, whereas there was
similar in both groups before BPV. Following BPV, both no change in Group II patients (Figure 33). Analyzing
62
frontal plane and horizontal plane mean QRS vectors the time course of reduction of RV voltages in Group I
Volume 2 Issue 1 (2024) 9 https://doi.org/10.36922/bh.2406