
Page 27 - BH-2-1
P. 27
Brain & Heart Pictorial rendition pulmonary stenosis
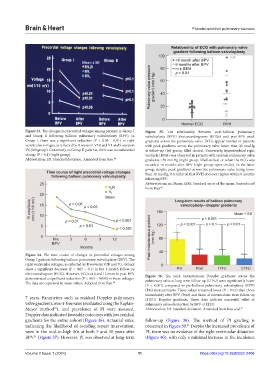
Figure 33. The changes in precordial voltages among patients in Group I Figure 35. The relationship between post-balloon pulmonary
and Group II following balloon pulmonary valvuloplasty (BPV). In valvuloplasty (BPV) electrocardiograms (ECGs) and post-BPV peak
Group I, there was a significant reduction (P < 0.05 – 0.01) in right gradients across the pulmonary valve. ECGs appear normal in patients
ventricular voltages, as reflected by R waves in V3R and V1 and S waves in with peak gradients across the pulmonary valve lower than 30 mmHg
V6 (left group). Conversely, in Group II patients, there was no substantial at follow-up (left group; filled circles). Conversely, hypertrophied right
change (P > 0.1) (right group). ventricle (RVH) was observed in patients with residual pulmonary valve
Abbreviation: SD: Standard deviation. Amended from Rao. 48 gradients >30 mmHg (right group; filled circles) or when the ECG was
recorded <6 months after BPV (right group; open circles). In the latter
group, despite peak gradients across the pulmonary valve being lower
than 30 mmHg, it is inferred that RVH does not regress within 6 months
following BPV.
Abbreviations: m: Mean; SEM: Standard error of the mean. Reproduced
from Rao. 48
Figure 34. The time course of changes in precordial voltages among
Group I patients following balloon pulmonary valvuloplasty (BPV). The
right ventricular voltages, as reflected by R waves in V3R and V1, did not
show a significant decrease (P > 0.05 – 0.1) in the 3-month follow-up
electrocardiogram (ECG). However, ECGs at 6 and 12 months post-BPV Figure 36. The peak instantaneous Doppler gradients across the
demonstrated a significant reduction (P < 0.05 – 0.001) in these voltages. pulmonary valve at long-term follow-up (LTFU) were significantly lower
The data are expressed in mean values. Adopted from Rao. 48
(P < 0.001) compared to pre-balloon pulmonary valvuloplasty (BPV)
(Pre) measurements. These values remained lower (P < 0.01) than those
immediately after BPV (Post) and those at intermediate-term follow-up
7 years. Parameters such as residual Doppler pulmonary (ITFU) Doppler gradients. These data indicate successful relief of
valve gradients, event-free rates (evaluated using the Kaplan- pulmonary valve obstruction by BPV at LTFU.
Meyer method ), and prevalence of PI were assessed. Abbreviation: SD: Standard deviation. Amended from Rao et al. 21
63
Doppler data indicated favorable outcomes with low residual
gradients for the entire cohort (Figure 36). Actuarial rates, follow-up (Figure 38). The method of PI grading is
indicating the likelihood of avoiding repeat intervention, presented in Figure 39. Despite the increased prevalence of
21
were in the mid-to-high 80s at both 5 and 10 years after PI, there was no evidence of the right ventricular dilatation
BPV (Figure 37). However, PI was observed at long-term (Figure 40), with only a minimal increase in the incidence
21
Volume 2 Issue 1 (2024) 11 https://doi.org/10.36922/bh.2406