
Page 24 - BH-2-1
P. 24
Brain & Heart Pictorial rendition pulmonary stenosis
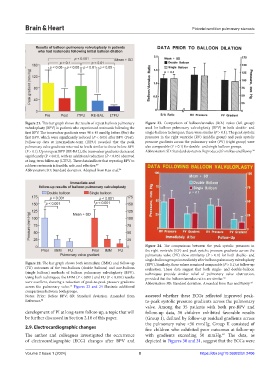
Figure 21. This bar graph shows the results of repeat balloon pulmonary Figure 23. Comparison of balloon/annulus (B/A) ratios (left group)
valvuloplasty (BPV) in patients who experienced restenosis following the used for balloon pulmonary valvuloplasty (BPV) in both double- and
first BPV. The transvalvar gradients were 98 ± 45 mmHg before (Pre) the single-balloon techniques; these were similar (P > 0.1). The peak systolic
first BPV, which were significantly reduced (P < 0.05) after BPV (Post). pressures in the right ventricle (RV) (middle group) and peak systolic
Follow-up data at intermediate-term (ITFU) revealed that the peak pressure gradients across the pulmonary valve (PV) (right group) were
pulmonary valve gradients returned to levels similar to those before BPV also comparable (P > 0.1) for double- and single-balloon groups.
(P > 0.1). Upon repeat BPV (RE-BAL), the transvalvar gradients decreased Abbreviation: SD: Standard deviation. Reproduced from Rao and Fawzy. 58
significantly (P < 0.01), with an additional reduction (P < 0.05) observed
at long-term follow-up (LTFU). These data indicate that repeating BPV to
address restenosis is feasible, safe, and effective. 49
Abbreviation: SD: Standard deviation. Adopted from Rao et al. 54
Figure 24. The comparisons between the peak systolic pressures in
the right ventricle (RV) and peak systolic pressure gradients across the
pulmonary valve (PV) show similarity (P > 0.1) for both double- and
single-balloon groups immediately after balloon pulmonary valvuloplasty
Figure 22. The bar graph shows both immediate (IMM) and follow-up (BPV). Similarly, these values remained comparable (P > 0.1) at follow-up
(FU) outcomes of the two-balloon (double balloon) and one-balloon evaluation. These data suggest that both single- and double-balloon
(single balloon) methods of balloon pulmonary valvuloplasty (BPV). techniques provide similar relief of pulmonary valve obstruction,
Using both techniques, the IMM (P < 0.001) and FU (P < 0.001) results provided that the balloon/annulus ratios are similar. 58
were excellent, showing a reduction of peak-to-peak pressure gradients Abbreviation: SD: Standard deviation. Amended from Rao and Fawzy. 58
53
across the pulmonary valve. Figures 23 and 24 illustrate additional
comparisons between both groups.
Notes: Prior: Before BPV; SD: Standard deviation. Amended from assessed whether these ECGs reflected improved peak-
Reference. 58 to-peak systolic pressure gradients across the pulmonary
valve. Among the 35 patients with both pre-BPV and
development of PI at long-term follow-up, a topic that will follow-up data, 30 children exhibited favorable results
be further discussed in Section 2.10 of this paper. (Group I), defined by follow-up residual gradients across
the pulmonary valve <50 mmHg. Group II consisted of
2.9. Electrocardiographic changes five children who exhibited poor outcomes at follow-up
The author and colleagues investigated the occurrence with gradients exceeding 50 mmHg. The data, as
62
of electrocardiographic (ECG) changes after BPV and depicted in Figures 30 and 31, suggest that the ECGs were
Volume 2 Issue 1 (2024) 8 https://doi.org/10.36922/bh.2406