
Page 34 - BH-2-2
P. 34
Brain & Heart Predictive modeling using electroencephalogram
characteristics and will make full use of its dynamics when
dealing with the behavior of a keen subject while operating
the vehicle. Cars can be maneuvered with lightning speed
and pinpoint accuracy. Any unintended responses are
promptly adjusted. Attitudes of aggression have been
linked to stimuli with a high arousal value but a negative
valence. An aggressive operator is one who takes great
risks in pursuit of his goals and is known for using forceful
methods to achieve them. An inexperienced person’s
emotional state is low arousal and negative valence,
characterized by fatigue and boredom. This causes drivers
to veer off course, speed up and slow down unexpectedly,
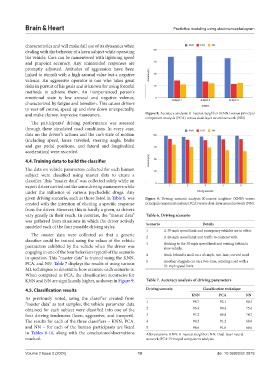
and make clumsy, imprecise maneuvers. Figure 8. Accuracy analysis: K-nearest neighbor (KNN) versus principal
component analysis (PCA) versus dual-layer neural network (NN).
The participants’ driving performance was assessed
through these simulated road conditions. In every case,
data on the driver’’s actions and the car’s state of motion
(including speed, lanes traveled, steering angle, brake
and gas pedal positions, and lateral and longitudinal
acceleration) were recorded.
4.4. Training data to build the classifier
The data on vehicle parameters collected for each human
subject were classified using master data to create a
classifier. This “master data” was collected solely while an
expert driver carried out the same driving maneuvers while
under the influence of various psychedelic drugs. Any
given driving scenario, such as those listed in Table 6, was Figure 9. Driving scenario analysis: K-nearest neighbor (KNN) versus
created with the intention of eliciting a specific response principal component analysis (PCA) versus dual-layer neural network (NN).
from the driver. However, this is hardly a given, as drivers
vary greatly in their reach. In contrast, the “master data” Table 6. Driving scenario
was gathered from situations in which the driver actively
modeled each of the four possible driving styles. Scenario Details
1 A 35-mph speed limit and emergency vehicles are in effect.
The master data were collected so that a generic 2 A 40-mph speed limit and traffic to contend with.
classifier could be trained using the values of the vehicle
parameters exhibited by the vehicle when the driver was 3 Sticking to the 30-mph speed limit and waiting behind a
slow vehicle.
engaging in one of the four behaviors typical of the scenario 4 Stuck behind a snail on a 45-mph, two-lane, curved road
in question. This “master data” is trained using the KNN,
PCA, and NN. Table 7 displays the results of using various 5 Another sluggish car on a two-lane, winding road with a
50-mph speed limit.
ML techniques to determine how accurate each scenario is.
When compared to PCA, the classification accuracies for
KNN and NN are significantly higher, as shown in Figure 9. Table 7. Accuracy analysis of driving parameters
4.5. Classification results Driving scenario Classification technique
KNN PCA NN
As previously noted, using the classifier created from
“master data” as test samples, the vehicle parameter data 1 98.7 92.1 80.3
obtained for each subject were classified into one of the 2 96.4 90.4 75.6
four driving tendencies (keen, aggressive, and inexpert). 3 97.2 89.8 74.7
The results for each of the three classifiers – KNN, PCA, 4 99.2 91.2 68.8
and NN – for each of the human participants are listed 5 98.6 91.6 66.6
in Tables 8-10, along with the conclusions/observations Abbreviations: KNN: K-nearest neighbor; NN: Dual-layer neural
reached. network; PCA: Principal component analysis.
Volume 2 Issue 2 (2024) 10 doi: 10.36922/bh.2819