
Page 51 - BH-2-2
P. 51
Brain & Heart Cerebral venous sinus assessment using MRI and CT
2.4. Anatomical parameters for comparison (CTV − MRI )
The anatomical parameters for comparison included the DIAR = Diameter Diameter
CT
minimum and maximum cross-sectional area of the segment Diameter (II)
(CSA), degree of stenosis calculated as the ratio between the In cases where a segment was absent, its diameter was
minimum and maximum CSA, volume (V) of the segment, represented as 0. Specifically, if a segment was absent in
segment length of the sinus (SL), the angle of the segment the CTV-based geometry, the denominator of DIAR was
(α), and average curvature of the segment (Equation I): replaced by MRI Diameter .
SL We conducted a sinus-wise analysis by comparing the
=
Curvature number of entrances and exits of each sinus and major
α (I) venous sinuses, including the SSS, inferior sinus, StS,
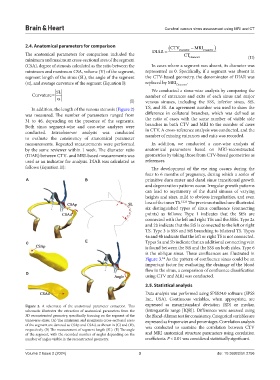
In addition, the length of the venous stenosis (Figure 2) TS, and SS. An agreement number was used to show the
was measured. The number of parameters ranged from difference in collateral branches, which was defined as
31 to 46, depending on the presence of the segments. the ratio of cases with the same number of visible side
Both sinus segment-wise and case-wise analyses were branches in both CTV and MRI to the number of cases
conducted. Intraobserver analysis was conducted in CTV. A cross-reference analysis was conducted, and the
to evaluate the consistency of anatomical parameter number of missing entrances and exits was recorded.
measurements. Repeated measurements were performed In addition, we conducted a case-wise analysis of
by the same reviewer within 1 week. The diameter ratio anatomical parameters based on MRI-reconstructed
(DIAR) between CTV- and MRI-based measurements was geometries by taking those from CTV-based geometries as
used as an indicator for analysis. DIAR was calculated as references.
follows (Equation II): The development of the eye ring occurs during the
four to 6 months of pregnancy, during which a series of
A B primitive dura mater and dural sinus transitional growth
and degeneration patterns occur. Irregular growth patterns
can lead to asymmetry of the dural sinuses of varying
heights and sizes, mild to obvious irregularities, and even
loss of the inner TS. 12,13 The previous studies have illustrated
six distinguished types of sinus confluence (connecting
points) as follows: Type 1 indicates that the StSs are
connected with the left and right TSs and the SSSs. Type 2a
and 2b indicate that the StS is connected to the left or right
TS. Type 3 is SSS and StS branching to bilateral TS. Types
4a and 4b indicate that the left or right TS is not connected.
C E Types 5a and 5b indicate that an additional connecting vein
is found between the StS and the SSS on both sides. Type 6
is the oblique sinus. These confluences are illustrated in
Figure 3. As the pattern of confluence sinus could be an
14
important factor for evaluating the drainage of the blood
flow in the sinus, a comparison of confluence classification
D
using CTV and MRI was conducted.
2.5. Statistical analysis
Data analysis was performed using SPSS24.0 software (SPSS
Inc., USA). Continuous variables, when appropriate, are
Figure 2. A schematic of the anatomical parameter extraction. This expressed as mean±standard deviation (SD) or median
schematic illustrates the extraction of anatomical parameters from the (interquartile range [IQR]). Differences were assessed using
3D reconstructed geometry, specifically focusing on the segment of the the Bland-Altman test for consistency. Categorical variables are
transverse sinus. (A) The minimum and maximum cross-sectional areas expressed as frequencies and percentages. Correlation analysis
of the segment are denoted as CSAp and CSAd, as shown in (C) and (D), was conducted to examine the correlation between CTV
respectively. (B) The measurement of segment length (SL). (E) The angle
of the segment, with the recorded number of angles depending on the and MRI anatomical structure parameters using correlation
number of angles visible in the reconstructed geometry. coefficients. P < 0.01 was considered statistically significant.
Volume 2 Issue 2 (2024) 3 doi: 10.36922/bh.2756