
Page 54 - BH-2-2
P. 54
Brain & Heart Cerebral venous sinus assessment using MRI and CT
A B
C D
E F
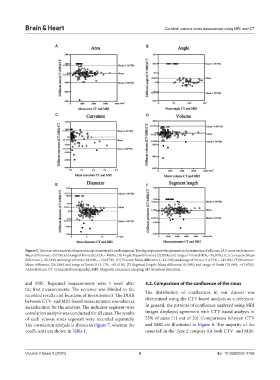
Figure 5. The case-wise analysis of anatomical parameters for each segment. This figure presents the geometrical parameters of all cases. (A) Cross-section area:
Mean difference (−5.01%) and range of limits (82.92%, −100%). (B) Angle: Mean difference (22.08%) and range of limits (100%, −56.85%). (C) Curvature: Mean
difference (−36.54%) and range of limits (81.80%, −154.87%). (D) Volume: Mean difference (−14.22%) and range of limits (114.57%, −143.0%). (E) Diameter:
Mean difference (26.38%) and range of limits (115.17%, −62.41%). (F) Segment length: Mean difference (6.50%) and range of limits (76.84%, −63.83%).
Abbreviations: CT: Computed tomography; MRI: Magnetic resonance imaging; SD: Standard deviation.
and MRI. Repeated measurements were 1 week after 3.2. Comparison of the confluence of the sinus
the first measurements. The reviewer was blinded to the The distribution of confluences in our dataset was
recorded results and locations of measurement. The DIAR
between CTV- and MRI-based measurements was taken as determined using the CTV-based analysis as a reference.
an indication for the analysis. The indicator segment-wise In general, the patterns of confluence analyzed using MRI
correlation analysis was conducted for all cases. The results images displayed agreement with CTV-based analysis in
of each venous sinus segment were recorded separately. 55% of cases (11 out of 20). Comparisons between CTV
The correlation analysis is shown in Figure 7, whereas the and MRI are illustrated in Figure 8. The majority of the
coefficients are shown in Table 1. cases fall in the Type 2 category for both CTV- and MRI-
Volume 2 Issue 2 (2024) 6 doi: 10.36922/bh.2756