
Page 55 - BH-2-2
P. 55
Brain & Heart Cerebral venous sinus assessment using MRI and CT
A B
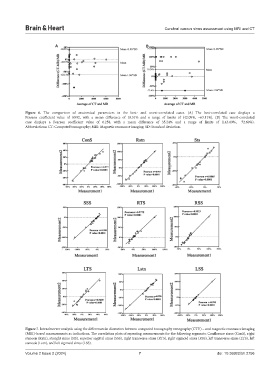
Figure 6. The comparison of anatomical parameters in the best- and worst-correlated cases. (A) The best-correlated case displays a
Pearson coefficient value of 0.992, with a mean difference of 10.51% and a range of limits of (42.09%, −63.11%). (B) The worst-correlated
case displays a Pearson coefficient value of 0.258, with a mean difference of 35.24% and a range of limits of (143.09%, −72.60%).
Abbreviations: CT: Computed tomography; MRI: Magnetic resonance imaging; SD: Standard deviation.
Figure 7. Intraobserver analysis using the differences in diameters between computed tomography venography (CTV) – and magnetic resonance imaging
(MRI)-based measurements as indications. The correlation plots of repeating measurements for the following segments: Confluence sinus (ConS), right
stenosis (Rstn), straight sinus (StS), superior sagittal sinus (SSS), right transverse sinus (RTS), right sigmoid sinus (RSS), left transverse sinus (LTS), left
stenosis (Lstn), and left sigmoid sinus (LSS).
Volume 2 Issue 2 (2024) 7 doi: 10.36922/bh.2756