
Page 53 - BH-2-2
P. 53
Brain & Heart Cerebral venous sinus assessment using MRI and CT
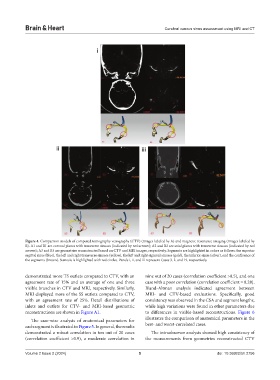
Figure 4. Comparison models of computed tomography venography (CTV) (images labeled by A) and magnetic resonance imaging (images labeled by
B). A1 and B1 are coronal planes with transverse sinuses (indicated by red arrows); A2 and B2 are axial planes with transverse sinuses (indicated by red
arrows); A3 and B3 are geometries reconstructed based on CTV and MRI images, respectively. Segments are highlighted in colors as follows: the superior
sagittal sinus (blue), the left and right transverse sinuses (yellow), the left and right sigmoid sinuses (gold), the inferior sinus (silver), and the confluence of
the segments (brown). Stenosis is highlighted with red circles. Panels i, ii, and iii represent Cases 3, 2, and 19, respectively.
demonstrated more TS outlets compared to CTV, with an nine out of 20 cases (correlation coefficient >0.5), and one
agreement rate of 15% and an average of one and three case with a poor correlation (correlation coefficient = 0.28).
visible branches in CTV and MRI, respectively. Similarly, Bland-Altman analysis indicated agreement between
MRI displayed more of the SS outlets compared to CTV, MRI- and CTV-based evaluations. Specifically, good
with an agreement rate of 25%. Detail distributions of consistency was observed in the CSA and segment lengths,
inlets and outlets for CTV- and MRI-based geometric while high variations were found in other parameters due
reconstructions are shown in Figure A1. to differences in visible-based reconstructions. Figure 6
illustrates the comparison of anatomical parameters in the
The case-wise analysis of anatomical parameters for
each segment is illustrated in Figure 5. In general, the results best- and worst-correlated cases.
demonstrated a robust correlation in ten out of 20 cases The intraobserver analysis showed high consistency of
(correlation coefficient >0.9), a moderate correlation in the measurements from geometries reconstructed CTV
Volume 2 Issue 2 (2024) 5 doi: 10.36922/bh.2756