
Page 114 - EER-2-1
P. 114
Explora: Environment
and Resource Carbon neutrality and low-carbon behavior in space tourism
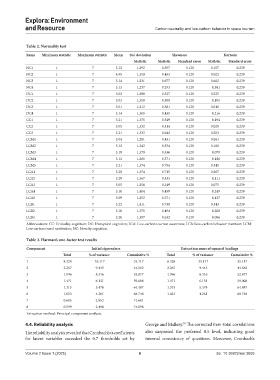
Table 2. Normality test
Items Minimum statistic Maximum statistic Mean Std. deviation Skewness Kurtosis
Statistic Statistic Standard error Statistic Standard error
NC1 1 7 5.12 1.292 −0.597 0.120 0.157 0.239
NC2 1 7 4.95 1.350 −0.463 0.120 0.022 0.239
NC3 1 7 5.14 1.231 −0.677 0.120 0.602 0.239
NC4 1 7 5.13 1.237 −0.293 0.120 −0.381 0.239
DC1 1 7 5.02 1.288 −0.527 0.120 0.225 0.239
DC2 1 7 5.03 1.358 −0.508 0.120 −0.105 0.239
DC3 1 7 5.01 1.213 −0.381 0.120 0.010 0.239
DC4 1 7 5.14 1.305 −0.435 0.120 −0.216 0.239
CC1 1 7 5.21 1.375 −0.549 0.120 −0.194 0.239
CC2 1 7 5.05 1.332 −0.514 0.120 0.020 0.239
CC3 1 7 5.21 1.333 −0.642 0.120 0.253 0.239
LCM1 1 7 5.04 1.281 −0.431 0.120 0.081 0.239
LCM2 1 7 5.12 1.343 −0.554 0.120 0.100 0.239
LCM3 1 7 5.19 1.379 −0.536 0.120 −0.079 0.239
LCM4 1 7 5.12 1.265 −0.371 0.120 −0.186 0.239
LCM5 1 7 5.21 1.374 −0.754 0.120 0.345 0.239
LCA1 1 7 5.28 1.374 −0.715 0.120 0.267 0.239
LCA2 1 7 5.29 1.367 −0.533 0.120 −0.111 0.239
LCA3 1 7 5.05 1.256 −0.349 0.120 0.075 0.239
LCA4 1 7 5.10 1.404 −0.459 0.120 −0.249 0.239
LCA5 1 7 5.09 1.252 −0.371 0.120 −0.127 0.239
LCB1 1 7 5.22 1.411 −0.738 0.120 0.343 0.239
LCB2 1 7 5.10 1.375 −0.494 0.120 −0.208 0.239
LCB3 1 7 5.20 1.397 −0.632 0.120 −0.096 0.239
Abbreviations: CC: Criticality cognition; DC: Disruption cognition; LCA: Low-carbon tourism awareness; LCB: Low-carbon behavior intention; LCM:
Low-carbon travel motivation; NC: Novelty cognition.
Table 3. Harman’s one‑factor test results
Component Initial eigenvalues Extraction sums of squared loadings
Total % of variance Cumulative % Total % of variance Cumulative %
1 8.428 35.117 35.117 8.428 35.117 35.117
2 2.267 9.445 44.562 2.267 9.445 44.562
3 1.996 8.316 52.877 1.996 8.316 52.877
4 1.471 6.131 59.008 1.471 6.131 59.008
5 1.315 5.478 64.487 1.315 5.478 64.487
6 1.023 4.261 68.748 1.023 4.261 68.748
7 0.685 2.853 71.601
8 0.599 2.498 74.098
Extraction method: Principal component analysis.
4.4. Reliability analysis George and Mallery. The corrected item-total correlations
55
The reliability analysis revealed that Cronbach’s α coefficients also surpassed the preferred 0.5 level, indicating good
for latent variables exceeded the 0.7 thresholds set by internal consistency of questions. Moreover, Cronbach’s
Volume 2 Issue 1 (2025) 6 doi: 10.36922/eer.3655