
Page 116 - EER-2-1
P. 116
Explora: Environment
and Resource Carbon neutrality and low-carbon behavior in space tourism
Table 5. Overall exploratory factor analysis results
Construct Items Component Communalities KMO
1 2 3 4 5 6
NC NC1 0.076 0.219 0.131 0.756 0.056 0.076 0.652 0.877
NC2 0.161 0.058 0.261 0.688 0.153 0.190 0.630
NC3 0.197 0.064 0.139 0.725 0.188 0.018 0.624
NC4 0.129 0.131 0.210 0.743 0.136 0.080 0.655
DC DC1 0.125 0.174 0.788 0.148 0.079 0.148 0.717
DC2 0.110 0.089 0.772 0.146 0.136 0.123 0.672
DC3 0.062 0.050 0.741 0.250 0.159 0.082 0.649
DC4 0.151 0.166 0.775 0.172 0.131 0.132 0.715
CC CC1 0.188 0.168 0.138 0.156 0.792 0.086 0.741
CC2 0.122 0.125 0.156 0.191 0.805 0.121 0.755
CC3 0.102 0.192 0.186 0.146 0.831 0.114 0.807
LCM LCM1 0.777 0.156 0.092 0.109 0.066 0.145 0.674 0.878
LCM2 0.774 0.101 0.096 0.159 0.108 0.133 0.674
LCM3 0.787 0.137 0.091 0.087 0.075 0.093 0.668
LCM4 0.814 0.126 0.115 0.116 0.104 0.110 0.728
LCM5 0.774 0.173 0.085 0.115 0.124 0.126 0.680
LCA LCA1 0.138 0.728 0.150 0.039 0.141 0.327 0.701 0.829
LCA2 0.156 0.813 0.087 0.101 0.140 0.131 0.740
LCA3 0.232 0.738 0.070 0.209 0.094 −0.019 0.656
LCA4 0.096 0.612 0.118 0.116 0.100 0.374 0.561
LCA5 0.142 0.793 0.140 0.101 0.126 0.145 0.716
LCB LCB1 0.328 0.250 0.155 0.126 0.049 0.643 0.625 0.700
LCB2 0.169 0.168 0.131 0.133 0.157 0.803 0.761
LCB3 0.158 0.290 0.219 0.075 0.123 0.723 0.701
Rotation sums of Total 3.573 3.235 2.797 2.529 2.278 2.086
squared loadings % of variance 14.889 13.480 11.654 10.538 9.493 8.693
Cumulative % 14.889 28.370 40.023 50.561 60.054 68.748
Note: Value in boldface indicates factor loadings.
Abbreviations: CC: Criticality cognition; DC: Disruption cognition; KMO: Kaiser’s measure of sampling adequacy; LCA: Low-carbon tourism
awareness; LCB: Low-carbon behavior intention; LCM: Low-carbon travel motivation; NC: Novelty cognition.
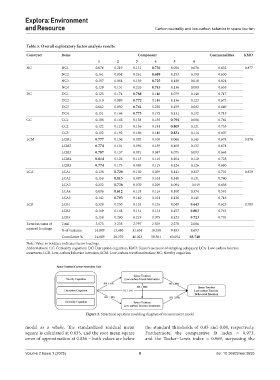
Figure 2. Structural equation modeling diagram of measurement model
model as a whole. The standardized residual mean the standard thresholds of 0.05 and 0.08, respectively.
square is calculated at 0.035, and the root mean square Furthermore, the comparative fit index = 0.973,
error of approximation at 0.036 – both values are below and the Tucker–Lewis index = 0.969, surpassing the
Volume 2 Issue 1 (2025) 8 doi: 10.36922/eer.3655