
Page 113 - EER-2-3
P. 113
Explora: Environment
and Resource Enzymatic degradation
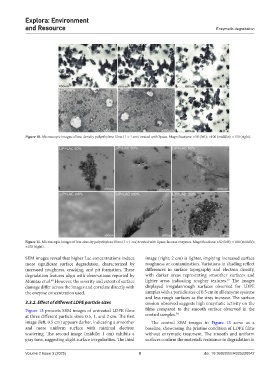
Figure 10. Microscopic images of low-density polyethylene films (1 × 1 cm) treated with lipase. Magnifications: ×50 (left); ×100 (middle); ×150 (right).
Figure 11. Microscopic images of low-density polyethylene films (1 × 1 cm) treated with lipase-laccase enzymes. Magnifications: ×50 (left); ×100 (middle);
×150 (right).
SEM images reveal that higher Lac concentrations induce image (right; 2 cm) is lighter, implying increased surface
more significant surface degradation, characterized by roughness or contamination. Variations in shading reflect
increased roughness, cracking, and pit formation. These differences in surface topography and electron density,
degradation features align with observations reported by with darker areas representing smoother surfaces and
73
Mumtaz et al. However, the severity and extent of surface lighter areas indicating rougher textures. The images
68
damage differ across the images and correlate directly with displayed irregular/rough surfaces observed for LDPE
the enzyme concentration used. samples with a particle size of 0.5 cm in all enzyme systems
and less rough surfaces as the sizes increase. The surface
3.3.2. Effect of different LDPE particle sizes erosion observed suggests high enzymatic activity on the
Figure 13 presents SEM images of untreated LDPE films films compared to the smooth surface observed in the
at three different particle sizes: 0.5, 1, and 2 cm. The first control samples. 74
image (left; 0.5 cm) appears darker, indicating a smoother The control SEM images in Figure 13 serve as a
and more uniform surface with minimal electron baseline, showcasing the pristine condition of LDPE films
scattering. The second image (middle; 1 cm) exhibits a without enzymatic treatment. The smooth and uniform
gray tone, suggesting slight surface irregularities. The third surfaces confirm the material’s resistance to degradation in
Volume 2 Issue 3 (2025) 8 doi: 10.36922/EER025220042