
Page 114 - EER-2-3
P. 114
Explora: Environment
and Resource Enzymatic degradation
Figure 12. Microscopic images of low-density polyethylene films (1 × 1 cm) treated with laccase. Magnifications: ×50 (left); ×100 (middle); ×150 (right).
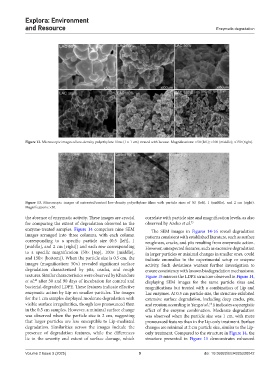
Figure 13. Microscopic images of untreated/control low-density polyethylene films with particle sizes of 0.5 (left), 1 (middle), and 2 cm (right).
Magnifications: ×50.
the absence of enzymatic activity. These images are crucial correlate with particle size and magnification levels, as also
for comparing the extent of degradation observed in the observed by Azeko et al. 75
enzyme-treated samples. Figure 14 comprises nine SEM The SEM images in Figures 14-16 reveal degradation
images arranged into three columns, with each column patterns consistent with established literature, such as surface
corresponding to a specific particle size (0.5 [left], 1 roughness, cracks, and pits resulting from enzymatic action.
[middle], and 2 cm [right]) and each row corresponding However, unexpected features, such as excessive degradation
to a specific magnification (50× [top], 100× [middle], in larger particles or minimal changes in smaller ones, could
and 150× [bottom]). When the particle size is 0.5 cm, the indicate anomalies in the experimental setup or enzyme
images (magnification: 50×) revealed significant surface activity. Such deviations warrant further investigation to
degradation characterized by pits, cracks, and rough ensure consistency with known biodegradation mechanisms.
textures. Similar characteristics were observed by Khandare Figure 15 mirrors the LDPE structure observed in Figure 14,
49
et al. after 30 and 90 days of incubation for control and displaying SEM images for the same particle sizes and
bacterial-degraded LDPE. These features indicate effective magnifications but treated with a combination of Lip and
enzymatic action by Lip on smaller particles. The images Lac enzymes. At 0.5 cm particle size, the structure exhibited
for the 1 cm samples displayed moderate degradation with extensive surface degradation, including deep cracks, pits,
visible surface irregularities, though less pronounced than and erosion; according to Yang et al., it indicates a synergistic
56
in the 0.5 cm samples. However, a minimal surface change effect of the enzyme combination. Moderate degradation
was observed when the particle size is 2 cm, suggesting was observed when the particle size was 1 cm, with more
that larger particles are less susceptible to Lip-mediated pronounced features than in the Lip-only treatment. Surface
degradation. Similarities across the images include the changes are minimal at 2 cm particle size, similar to the Lip-
presence of degradation features, while the differences only treatment. Compared to the structure in Figure 14, the
lie in the severity and extent of surface damage, which structure presented in Figure 15 demonstrates enhanced
Volume 2 Issue 3 (2025) 9 doi: 10.36922/EER025220042