
Page 112 - EER-2-3
P. 112
Explora: Environment
and Resource Enzymatic degradation
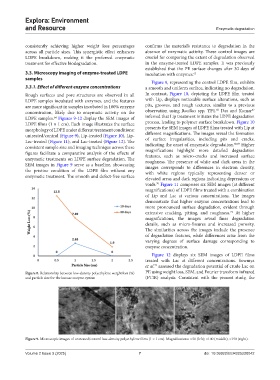
consistently achieving higher weight loss percentages confirms the material’s resistance to degradation in the
across all particle sizes. This synergistic effect enhances absence of enzymatic activity. These control images are
LDPE breakdown, making it the preferred enzymatic crucial for comparing the extent of degradation observed
treatment for effective biodegradation. in the enzyme-treated LDPE samples. It was previously
established that the PE surface changes after 30 days of
3.3. Microscopy imaging of enzyme-treated LDPE incubation with enzymes. 65
samples
Figure 9, representing the control LDPE film, exhibits
3.3.1. Effect of different enzyme concentrations a smooth and uniform surface, indicating no degradation.
Rough surfaces and pore structures are observed in all In contrast, Figure 10, depicting the LDPE film treated
LDPE samples incubated with enzymes, and the features with Lip, displays noticeable surface alterations, such as
are more significant in samples incubated in 100% enzyme pits, grooves, and rough textures, similar to a previous
66
67
concentration, likely due to enzymatic activity on the observation using Bacillus spp. YP1. Das and Kumar
64
LDPE samples. Figures 9-12 display the SEM images of inferred that Lip treatment initiates the LDPE degradation
LDPE films (1 × 1 cm). Each image illustrates the surface process, leading to polymer surface breakdown. Figure 10
morphology of LDPE under different treatment conditions: presents the SEM images of LDPE films treated with Lip at
untreated/control (Figure 9), Lip-treated (Figure 10), Lip- different magnifications. The images reveal the formation
Lac-treated (Figure 11), and Lac-treated (Figure 12). The of surface irregularities, including pits and cracks,
68,69
consistent sample size and imaging technique across these indicating the onset of enzymatic degradation. Higher
figures facilitate a comparative analysis of the effects of magnifications highlight more detailed degradation
features, such as micro-cracks and increased surface
enzymatic treatments on LDPE surface degradation. The roughness. The presence of white and dark areas in the
SEM images in Figure 9 serve as a baseline, showcasing images corresponds to differences in electron density,
the pristine condition of the LDPE film without any with white regions typically representing denser or
enzymatic treatment. The smooth and defect-free surface elevated areas and dark regions indicating depressions or
voids. Figure 11 comprises six SEM images (at different
70
magnifications) of LDPE films treated with a combination
of Lip and Lac at various concentrations. The images
demonstrate that higher enzyme concentrations lead to
more pronounced surface degradation, evident through
71
extensive cracking, pitting, and roughness. At higher
magnifications, the images reveal finer degradation
details, such as micro-fissures and increased porosity.
The similarities across the images include the presence
of degradation features, while differences arise from the
varying degrees of surface damage corresponding to
enzyme concentration.
Figure 12 displays six SEM images of LDPE films
treated with Lac at different concentrations. Sowmya
et al. assessed the degradation potential of crude Lac on
72
Figure 8. Relationship between low-density polyethylene weight loss (%) PE using weight loss, SEM, and Fourier transform infrared
and particle size for the laccase enzyme system (FTIR) analysis. Consistent with the present study, the
Figure 9. Microscopic images of untreated/control low-density polyethylene films (1 × 1 cm). Magnifications: ×50 (left); ×100 (middle); ×150 (right).
Volume 2 Issue 3 (2025) 7 doi: 10.36922/EER025220042