
Page 245 - EJMO-9-2
P. 245
Eurasian Journal of
Medicine and Oncology Prognosis of colon adenocarcinoma
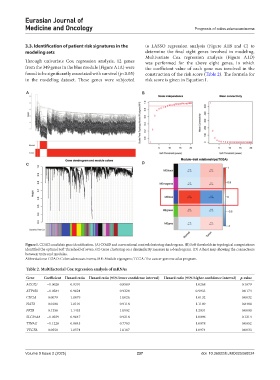
3.3. Identification of patient risk signatures in the to LASSO regression analysis (Figure A1B and C) to
modeling sets determine the final eight genes involved in modeling.
Multivariate Cox regression analysis (Figure A1D)
Through univariate Cox regression analysis, 12 genes was performed for the above eight genes, in which
from the 349 genes in the blue module (Figure A1A) were the coefficient value of each gene was involved in the
found to be significantly associated with survival (p<0.05) construction of the risk score (Table 2). The formula for
in the modeling dataset. These genes were subjected risk score is given in Equation I.
A B
C D
Figure 1. COAD candidate gene identification. (A) COAD and conventional control clustering dendrogram. (B) Soft thresholds in topological computations
identified the optimal Soft Threshold of seven. (C) Gene clustering on a dissimilarity measure in a dendrogram. (D) A heat map showing the connections
between traits and modules.
Abbreviations: COAD: Colon adenocarcinoma; ME: Module eigengene; TCGA: The cancer genome atlas program.
Table 2. Multifactorial Cox regression analysis of mRNAs
Gene Coefficient Hazard ratio Hazard ratio (95% lower confidence interval) Hazard ratio (95% higher confidence interval) p‑value
ACOX1 −0.0628 0.9391 0.8589 1.0268 0.1679
ATP8B1 −0.0384 0.9624 0.9324 0.9933 0.0174
CHGA 0.0079 1.0079 1.0026 1.0132 0.0032
NAT2 0.0100 1.0101 0.9118 1.1189 0.8480
PKIB 0.1356 1.1453 1.0902 1.2031 0.0000
SLC39A8 −0.0359 0.9647 0.9218 1.0096 0.1214
TINAG −0.1228 0.8845 0.7763 1.0078 0.0652
VEGFA 0.0558 1.0574 1.0187 1.0974 0.0033
Volume 9 Issue 2 (2025) 237 doi: 10.36922/EJMO025060024