
Page 246 - EJMO-9-2
P. 246
Eurasian Journal of
Medicine and Oncology Prognosis of colon adenocarcinoma
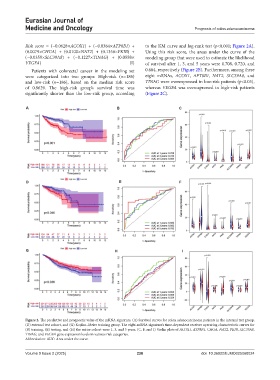
Risk score = (−0.0628×ACOX1) + (−0.0384×ATP8B1) + to the KM curve and log-rank test (p<0.001; Figure 2A).
(0.0079×CHGA) + (0.0100×NAT2) + (0.1356×PKIB) + Using this risk score, the areas under the curve of the
(−0.0359×SLC39A8) + (−0.1227×TINAG) + (0.0558× modeling group that were used to estimate the likelihood
VEGFA) (I) of survival after 1, 3, and 5 years were 0.708, 0.720, and
Patients with colorectal cancer in the modeling set 0.684, respectively (Figure 2B). Furthermore, among these
were categorized into two groups: High-risk (n=186) eight mRNAs, ACOX1, APT8B1, NAT2, SLC39A8, and
and low-risk (n=186), based on the median risk score TINAG were overexpressed in low-risk patients (p<0.05),
of 0.9629. The high-risk group’s survival time was whereas VEGFA was overexpressed in high-risk patients
significantly shorter than the low-risk group, according (Figure 2C).
A B C
D E F
G H I
Figure 2. The predictive and prognostic value of the mRNA signature. (A) Survival curves for colon adenocarcinoma patients in the internal test group,
(D) external test cohort, and (G) Kaplan–Meier training group. The eight-mRNA signature’s time-dependent receiver operating characteristic curves for
(B) training, (E) testing, and (H) the entire cohort were 1, 3, and 5 years. (C, F, and I) Violin plots of ACOX1, ATP8B1, CHGA, NAT2, PKIB, SLC39A8,
TINAG, and VEGFA gene expression levels in various risk categories.
Abbreviation: AUC: Area under the curve.
Volume 9 Issue 2 (2025) 238 doi: 10.36922/EJMO025060024