
Page 250 - EJMO-9-2
P. 250
Eurasian Journal of
Medicine and Oncology Prognosis of colon adenocarcinoma
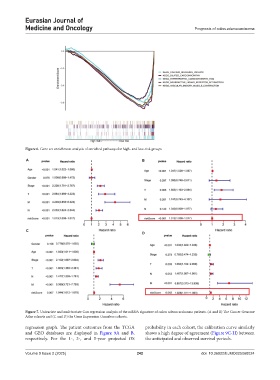
Figure 6. Gene set enrichment analysis of enriched pathways for high- and low-risk groups
A B
C
D
Figure 7. Univariate and multivariate Cox regression analysis of the mRNA signature of colon adenocarcinoma patients. (A and B) The Cancer Genome
Atlas cohorts and (C and D) the Gene Expression Omnibus cohorts.
regression graph. The patient outcomes from the TCGA probability in each cohort, the calibration curve similarly
and GEO databases are displayed in Figure 9A and B, shows a high degree of agreement (Figure 9C-H) between
respectively. For the 1-, 3-, and 5-year projected OS the anticipated and observed survival periods.
Volume 9 Issue 2 (2025) 242 doi: 10.36922/EJMO025060024