
Page 247 - EJMO-9-2
P. 247
Eurasian Journal of
Medicine and Oncology Prognosis of colon adenocarcinoma
3.4. Validation of the prognostic and predictive 274 were high-risk and 282 were low-risk, according to
accuracy of the eight-mRNA risk signature the model set’s median risk score. Based on the KM curve,
Out of the 246 patients, 124 were placed in the high-risk it was observed that the high-risk group’s survival time
group and 122 in the low-risk group based on the model was significantly shorter than the low-risk group (p<0.05;
set’s median risk score. The KM curve showed that the Figure 2G). The areas under the curve for estimating the
high-risk group’s survival time was significantly shorter probability of survival after 1, 3, and 5 years were 0.655,
than the low-risk group (p<0.05; Figure 2D). Using this 0.609, and 0.554, respectively (Figure 2H), after employing
risk score, the areas under the curve for estimating the the risk score. PKIB and CHGA were overexpressed
likelihood of survival at 1, 3, and 5 years were 0.682, in high-risk patients in the external validation queue,
0.682, and 0.782, respectively (Figure 2E). With VEGFA whereas VEGFA, TINAG, SLC38A8, ATP8B1, and ACOX1
overexpression in high-risk patients and ACOX1, were overexpressed in low-risk patients (Figure 2I).
APT8B1, NAT2, SLC39A8, and TINAG overexpression in In addition, the effect of the expression of these eight
low-risk patients, the internal validation set in the eight- mRNAs on the total TCGA cohort’s prognosis for patients
mRNA expression studies resembled the modeling set with colorectal cancer was analyzed. The cut-off value for
(Figure 2F). Furthermore, it is important to note that, these mRNAs was their median expression level. While
out of the 556 patients in the external validation cohort, PKIB8 (Figure 3E), VEGFA (Figure 3F), and TINAG
A B C
D E F
G H
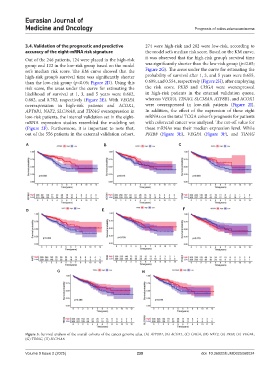
Figure 3. Survival analysis of the overall cohorts of the cancer genome atlas. (A) ATP8B1, (B) ACOX1, (C) CHGA, (D) NAT2, (E) PKIB, (F) VEGFA,
(G) TINAG, (H) SLC39A8.
Volume 9 Issue 2 (2025) 239 doi: 10.36922/EJMO025060024