
Page 248 - EJMO-9-2
P. 248
Eurasian Journal of
Medicine and Oncology Prognosis of colon adenocarcinoma
(Figure 3G) were not associated with survival outcomes, and found that the mutation frequency of NAT2 in the
survival analysis revealed that high expression of AT8B1 eight-mRNA was 8%, whereas PKIB had no mutations
(Figure 3A), ACOX1 (Figure 3B), CHGA (Figure 3C), (Figure 4I).
NAT2 (Figure 3D), and SL39AB (Figure 3H) were
protective prognostic variables. 3.6. Immune cell distribution across risk categories
Using the ssGSEA algorithm, we analyzed the TCGA
3.5. Protein expression levels and external and GEO queues and discovered that, compared to the
validation of genetic changes GEO queues, high- and low-risk groups in TCGA had
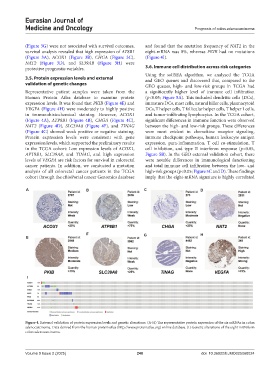
Representative patient samples were taken from the a significantly higher level of immune cell infiltration
Human Protein Atlas database to examine protein (p<0.05; Figure 5A). This included dendritic cells (DCs),
expression levels. It was found that PKIB (Figure 4E) and immature DCs, mast cells, natural killer cells, plasmacytoid
VEGFA (Figure 4H) were moderately to highly positive DCs, T helper cells, T follicular helper cells, T helper 1 cells,
in immunohistochemical staining. However, ACOX1 and tumor-infiltrating lymphocytes. In the TCGA cohort,
(Figure 4A), ATP8B1 (Figure 4B), CHGA (Figure 4C), significant differences in immune function were observed
NAT2 (Figure 4D), SLC39A8 (Figure 4F), and TINAG between the high- and low-risk groups. These differences
(Figure 4G) showed weak positive or negative staining. were most evident in chemokine receptor signaling,
Protein expression levels were consistent with gene immune checkpoint pathways, human leukocyte antigen
expression levels, which supported the preliminary results expression, para-inflammation, T cell co-stimulation, T
in the TCGA cohort: Low expression levels of ACOX1, cell inhibition, and type II interferon response (p<0.05,
APT8B1, SLC39A8, and TINAG, and high expression Figure 5B). In the GEO external validation cohort, there
levels of VEGFA are risk factors for survival in colorectal were notable differences in immunological functioning
cancer patients. In addition, we conducted a mutation and total immune cell infiltration between the low- and
analysis of all colorectal cancer patients in the TCGA high-risk groups (p<0.05; Figure 5C and D). These findings
cohort through the cBioPortal cancer Genomics database imply that the eight-mRNA signature is highly correlated
A B C D
F G H
E
I
Figure 4. External validation of protein expression levels and genetic alterations. (A-H) The representative protein expression of the six mRNAs in colon
adenocarcinoma. Data derived from the human protein atlas (http://www.proteinatlas.org) online database. (I) Genetic alterations of the eight mRNAs in
colon adenocarcinoma.
Volume 9 Issue 2 (2025) 240 doi: 10.36922/EJMO025060024