
Page 20 - ESAM-1-1
P. 20
Engineering Science in
Additive Manufacturing ML in MAM monitoring and control through images
Figure 13. The framework of defect detection based on support vector machine regression model
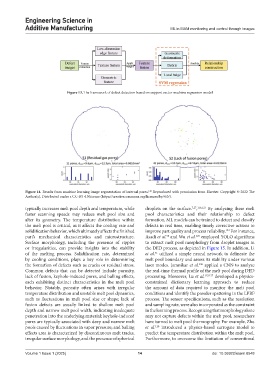
Figure 14. Results from machine learning image segmentation of internal pores. Reproduced with permission from Elsevier. Copyright © 2022 The
118
Author(s). Distributed under a CC-BY 4.0 license (https://creativecommons.org/licenses/by/4.0/).
typically increases melt pool depth and temperature, while droplets on the surface. , By analyzing these melt
7,27 116,123
faster scanning speeds may reduce melt pool size and pool characteristics and their relationship to defect
alter its geometry. The temperature distribution within formation, ML models can be trained to detect and classify
the melt pool is critical, as it affects the cooling rate and defects in real time, enabling timely corrective actions to
solidification behavior, which ultimately affects the finished improve part quality and process reliability. For instance,
124
50
125
part’s mechanical characteristics and microstructure. Asadi et al. and Wu et al. employed YOLO algorithms
Surface morphology, including the presence of ripples to extract melt pool morphology from droplet images in
or irregularities, can provide insights into the stability the DED process, as depicted in Figure 15. In addition, Li
51
of the melting process. Solidification rate, determined et al. utilized a simple neural network to delineate the
by cooling conditions, plays a key role in determining melt pool boundary and assess its stability under various
the formation of defects such as cracks or residual stress. laser modes. Jamnikar et al. applied a CNN to analyze
126
Common defects that can be detected include porosity, the real-time thermal profile of the melt pool during DED
lack of fusion, keyhole-induced pores, and balling effects, processing. Moreover, Lu et al. 113,127 developed a physics-
each exhibiting distinct characteristics in the melt pool constrained dictionary learning approach to reduce
behavior. Notably, porosity often arises with irregular the amount of data required to monitor the melt pool
temperature distribution and unstable melt pool dynamics, conditions and identify the powder spattering in the LPBF
such as fluctuations in melt pool size or shape; lack of process. The sensor specifications, such as the resolution
fusion defects are usually linked to shallow melt pool and sampling rate, were also incorporated as the constraint
depth and narrow melt pool width, indicating inadequate in the learning process. Recognizing that morphology alone
penetration into the underlying material; keyhole-induced may not capture defects within the melt pool, researchers
pores are typically associated with deep and narrow melt have turned to melt pool thermography. For example, Zhu
pools caused by fluctuations in vapor pressure; and balling et al. introduced a physics-based surrogate model to
128
effects area is characterized by discontinuous melt tracks, predict the temperature distribution within the melt pool.
irregular surface morphology, and the presence of spherical Furthermore, to overcome the limitation of conventional
Volume 1 Issue 1 (2025) 14 doi: 10.36922/esam.8548