
Page 19 - ESAM-1-1
P. 19
Engineering Science in
Additive Manufacturing ML in MAM monitoring and control through images
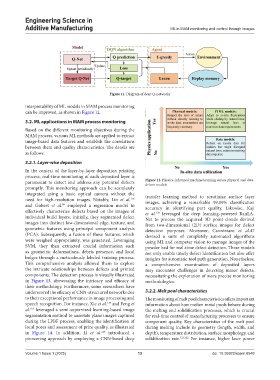
Figure 11. Diagram of deep Q-networks
interpretability of ML models in MAM process monitoring
can be improved, as shown in Figure 12.
3.2. ML applications in MAM process monitoring
Based on the different monitoring objectives during the
MAM process, various ML methods are applied to extract
image-based data features and establish the correlations
between them and quality characteristics. The details are
as follows.
3.2.1. Layer-wise deposition
In the context of the layer-by-layer deposition printing
process, real-time monitoring of each deposited layer is
paramount to detect and address any potential defects Figure 12. Physics-informed machine learning versus physical and data-
driven models
promptly. This monitoring approach can be seamlessly
integrated using a basic optical camera without the transfer learning method to scrutinize surface layer
116
need for high-resolution images. Notably, Lin et al. images, achieving a remarkable 99.89% classification
and Gobert et al. employed a regression model to accuracy in identifying part quality. Likewise, Kaji
99
effectively characterize defects based on the images of et al. leveraged the deep learning-powered RanLA-
120
individual build layers. Initially, they segmented defect Net to process the acquired 3D point clouds derived
images into distinct low-dimensional edge, texture, and from two-dimensional (2D) surface images for defect
geometric features using principal component analysis detection purposes. Moreover, Cannizzaro et al.47
(PCA). Subsequently, a fusion of these features, which devised a suite of completely automated algorithms
were weighed appropriately, was generated. Leveraging using ML and computer vision to manage images of the
SVM, they then extracted crucial information such powder bed for real-time defect detection. These models
as geometric deformations, debris presence, and local not only enable timely defect identification but also offer
bulges through a meticulously labeled training process. insights for automatic tool path generation. Nonetheless,
This comprehensive analysis allowed them to explore a comprehensive examination of deposited layers
the intricate relationships between defects and printed may encounter challenges in detecting minor defects,
components. The detection process is visually illustrated necessitating the exploration of more precise monitoring
in Figure 13, showcasing the intricacy and efficacy of methodologies.
their methodology. Furthermore, some researchers have
underscored the efficacy of CNN-structured networks due 3.2.2. Melt pool characteristics
to their exceptional performance in image processing and The monitoring of melt pool characteristics offers important
speech recognition. For instance, Xie et al. and Feng et information about how molten metal pools behave during
117
al. leveraged a semi-supervised learning-based image the melting and solidification processes, which is crucial
118
segmentation method to annotate plane images captured for real-time control of manufacturing processes to ensure
during the LPBF process, enabling the identification of component quality. Key characteristics of the melt pool
local pores and assessment of print quality, as illustrated during melting include its geometry (length, width, and
in Figure 14. In addition, Li et al. introduced a depth), temperature distribution, surface morphology, and
119
pioneering approach by employing a CNN-based deep solidification rate. 121,122 For instance, higher laser power
Volume 1 Issue 1 (2025) 13 doi: 10.36922/esam.8548