
Page 89 - ESAM-1-2
P. 89
Engineering Science in
Additive Manufacturing Porous structure performance improvement
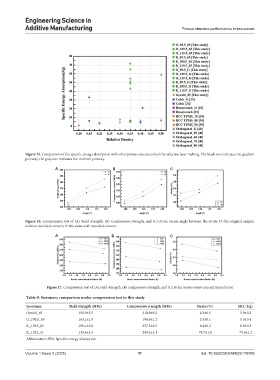
Figure 15. Comparison of the specific energy absorption with other porous structures built by selective laser melting. The black one indicates the gradient
porosity; the gray one indicates the uniform porosity.
A B C
Figure 16. Compression test of (A) Yield strength, (B) Compressive strength, and (C) strain versus angle between the struts. O=the original sample,
without rounded corners; R=the same with rounded corners.
A B C
Figure 17. Compression test of (A) yield strength, (B) compressive strength, and (C) strain versus stress concentration factor
Table 9. Summary comparison under compression test in this study
Specimen Yield strength (MPa) Compressive strength (MPa) Strain (%) SEA (J/g)
Gyroid_65 155.9±3.5 210.8±0.2 6.3±0.5 5.9±0.2
O_109.5_65 163.1±1.5 196.0±1.2 5.5±0.1 5.5±0.4
R_119.5_65 185.1±2.0 237.3±0.2 6.4±0.2 6.6±0.3
R_119.5_G 135.4±3.3 249.3±3.1 74.7±1.8 71.6±1.2
Abbreviation: SEA: Specific energy absorption.
Volume 1 Issue 2 (2025) 11 doi: 10.36922/ESAM025170009