
Page 88 - ESAM-1-2
P. 88
Engineering Science in
Additive Manufacturing Porous structure performance improvement
A B C
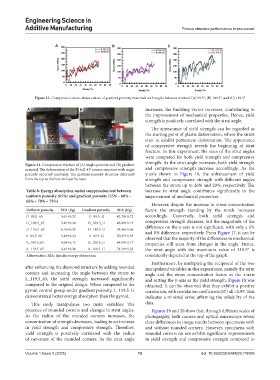
Figure 13. Compressive stress–strain curves of gradient porosity materials with angles between struts of (A) 99.5°, (B) 109.5°, and (C) 119.5°
A B increases, the buckling vector increases, contributing to
the improvement of mechanical properties. Hence, yield
strength is positively correlated with the strut angle.
The appearance of yield strength can be regarded as
the starting point of plastic deformation, where the struts
start to exhibit permanent deformation. The appearance
of compressive strength reveals the beginning of strut
fracture. In this experiment, the sizes of the strut angles
were compared for both yield strength and compressive
strength. As the strut angle increases, both yield strength
Figure 14. Compression fracture of (A) single-porosity and (B) gradient
material. The deformation of the Ti-6Al-4V porous structure with single and compressive strength increase accordingly. As the
porosity occurred randomly. The gradient-porosity structure deformed y-axis shown in Figure 16, the enhancement of yield
from the top to the bottom layer by layer. strength and compressive strength with different angles
between the struts up to 26% and 29%, respectively. The
Table 8. Energy absorption under compression test between increase in strut angle contributes significantly to the
uniform porosity (65%) and gradient porosity (55% – 60% – improvement of mechanical properties.
65% – 70% – 75%)
However, despite the increase in stress concentration
Uniform porosity SEA (J/g) Gradient porosity SEA (J/g) factor, the strength standing by the notch increases
O_99.5_65 5.01±0.22 O_99.5_G 42.78±0.72 accordingly. Conversely, both yield strength and
O_109.5_65 5.45±0.36 O_109.5_G 48.89±1.13 compressive strength decrease, but the magnitude of the
O_119.5_65 6.10±0.29 O_119.5_G 54.46±1.66 difference on the y-axis is not significant, with only a 6%
and 8% difference, respectively. From Figure 17, it can be
R_99.5_65 5.49±0.32 R_99.5_G 50.97±1.33 observed that the majority of the differences in mechanical
R_109.5_65 6.04±0.15 R_109.5_G 64.93±2.17 properties still stem from changes in the angle. Hence,
R_119.5_65 6.61±0.26 R_119.5_G 71.56±1.22 the strut angle with the maximum value of 119.5° is
Abbreviation: SEA: Specific energy absorption. consistently depicted at the top of the graph.
Furthermore, by multiplying the reciprocal of the two
after enhancing the diamond structure by adding rounded manipulated variables in this experiment, namely the strut
corners and increasing the angle between the struts to angle and the stress concentration factor, as the x-axis
L_119.5_65, the yield strength increased significantly and setting the y-axis as the yield strength, Figure 18 was
compared to the original design. When compared to the obtained. It can be observed that they exhibit a positive
gyroid control group under gradient porosity, L_119.5_G correlation, with correlation coefficients (R ) all >0.95. This
2
demonstrated better energy absorption than the gyroid. indicates a minimal error, affirming the reliability of the
This study manipulates two main variables: The data.
presence of rounded corners and changes in strut angles. Figures 19 and 20 show that, through different scales of
As the radius of the rounded corners increases, the photography, both camera and optical microscope reveal
concentration of strength decreases, leading to an increase clear differences in image results between specimens with
in yield strength and compressive strength. Therefore, and without rounded corners. However, specimens with
yield strength is positively correlated with the radius rounded corners do not exhibit significant improvements
of curvature of the rounded corners. As the strut angle in yield strength and compressive strength compared to
Volume 1 Issue 2 (2025) 10 doi: 10.36922/ESAM025170009