
Page 87 - ESAM-1-2
P. 87
Engineering Science in
Additive Manufacturing Porous structure performance improvement
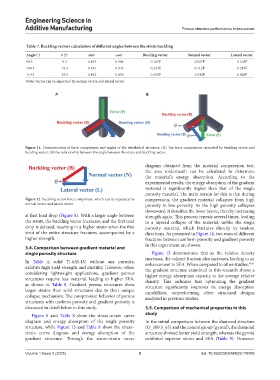
Table 7. Buckling vectors calculation of different angles between the struts buckling
Angle (°) θ (°) sinθ cosθ Buckling vector Normal vector Lateral vector
99.5 9.5 0.165 0.986 0.165F 0.027F 0.163F
109.5 19.5 0.334 0.943 0.334F 0.112F 0.315F
119.5 29.5 0.492 0.870 0.492F 0.242F 0.428F
Note: Vector can be separated by normal vector and lateral vector.
A B
Figure 11. Demonstration of force components and angles of the tetrahedral structure. (A) The force components separated by buckling vector and
bending vector; (B) the relationship between the angle between the struts and buckling vector.
diagram obtained from the material compression test,
the area underneath can be calculated to determine
the material’s energy absorption. According to the
experimental results, the energy absorption of the gradient
material is significantly higher than that of the single
porosity material. The main reason for this is that during
Figure 12. Buckling vector force component, which can be separated by compression, the gradient material collapses from high
normal vector and lateral vector porosity to low porosity. As the high porosity collapses
downward, it densifies the lower layers, thereby increasing
at first load drop (Figure 8). With a larger angle between strength again. This process repeats several times, leading
the struts, the buckling vector increases, and the first load to a layered collapse of the material, unlike the single
drop is delayed, resulting in a higher strain when the first porosity material, which fractures directly in random
strut of the entire structure fractures, accompanied by a directions. As presented in Figure 14, two ways of different
higher strength. fractures between uniform porosity and gradient porosity
in this experiment are shown.
3.4. Comparison between gradient material and
single porosity structure Figure 15 demonstrates that as the relative density
increases, the volume fraction also increases, leading to an
In Table 4, solid Ti-6Al-4V, without any porosity, enhancement in SEA. When compared to other studies, 40,41
exhibits high yield strength and ductility. However, when the gradient structure examined in this research shows a
considering lightweight applications, gradient porous higher energy absorption capacity at the average relative
structures require less material, leading to higher SEA, density. This indicates that optimizing the gradient
as shown in Table 8. Gradient porous structures show structure significantly improves its energy absorption
larger strains than solid structures due to their unique capabilities, outperforming other structural designs
collapse mechanism. The compression behavior of porous analyzed in previous studies.
structures with uniform porosity and gradient porosity is
discussed in detail below in this study. 3.5. Comparison of mechanical properties in this
Figure 6 and Table 8 show the stress–strain curve study
diagram and energy absorption of the single porosity In the initial comparison between the diamond structure
structure, while Figure 13 and Table 8 show the stress– (O_109.5_65) and the control group (gyroid), the diamond
strain curve diagram and energy absorption of the structure showed better yield strength, whereas the gyroid
gradient structure. Through the stress–strain curve exhibited superior strain and SEA (Table 9). However,
Volume 1 Issue 2 (2025) 9 doi: 10.36922/ESAM025170009