
Page 85 - ESAM-1-2
P. 85
Engineering Science in
Additive Manufacturing Porous structure performance improvement
Table 4. Mechanical properties of uniform‑porosity structure fabricated by selective laser melting in this study
Specimen Yield strength (MPa) Compressive strength (MPa) Strain at first load drop (%) Strain at failure (%) SEA (J/g)
Ti64_solid* 1213±102 1419±90 20.5 20.5 62.50
Ti64_solid 1309.67±28.11 1658.38±6.23 20.10±2.25 20.10±2.25 66.16±0.59
O_99.5_65 143.32±0.98 177.88±2.25 4.40±0.14 4.86±0.45 5.01±0.22
O_109.5_65 163.07±1.52 196.01±1.20 4.52±0.08 5.36±0.13 5.45±0.36
O_119.5_65 172.10±0.46 224.67±0.68 5.05±0.21 5.91±0.28 6.10±0.29
R_99.5_65 147.07±1.20 183.56±2.15 4.58±0.04 5.32±0.32 5.49±0.32
R_109.5_65 170.80±0.63 206.71±1.16 4.65±0.13 5.54±0.31 6.04±0.15
R_119.5_65 185.10±2.03 237.30±0.21 5.15±0.19 6.35±0.21 6.61±0.26
Note: *Mechanical properties of Ti64_solid are derived from another study, for the purpose compared with the Ti64_solid printed in our laboratory.
39
Abbreviation: SEA: Specific energy absorption.
Table 5. Maximum strength on the node in single‑porosity A B
material
Specimen d (mm) ρ (mm) k σ (MPa) σ (MPa)
max
O_99.5_65 0.71±0.01 0.16±0.01 5.21 F 5.21F
O_109.5_65 0.70±0.04 0.17±0.01 5.06 F 5.06F
O_119.5_65 0.68±0.06 0.16±0.03 5.12 F 5.12F
R_99.5_65 0.65±0.03 1.21±0.08 2.47 F 2.47F
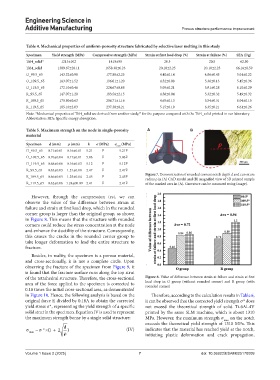
Figure 7. Demonstration of rounded corners notch depth d and curvature
R_109.5_65 0.66±0.05 1.25±0.04 2.45 F 2.45F
radius ρ in (A) CAD model and (B) magnified view of 3D printed sample
R_119.5_65 0.62±0.06 1.24±00.09 2.41 F 2.41F of the marked area in (A). Curvature can be measured using ImageJ.
However, through the compression test, we can
observe the value of the difference between strain at
failure and strain at first load drop, which in the rounded
corner group is larger than the original group, as shown
in Figure 8. This means that the structure with rounded
corners could reduce the stress concentration at the node
and enhance the ductility of the structure. Consequently,
this causes the cracks in the rounded corner group to
take longer deformation to lead the entire structure to
fracture.
Besides, in reality, the specimen is a porous material,
and cross-sectionally, it is not a complete circle. Upon
observing the fracture of the specimen from Figure 9, it
is found that the fracture surface runs along the top strut
of the tetrahedral structure. Therefore, the cross-sectional Figure 8. Value of difference between strain at failure and strain at first
area of the force applied to the specimen is corrected to load drop in O group (without rounded corner) and R group (with
rounded corner)
0.18 times the initial cross-sectional area, as demonstrated
in Figure 10. Hence, the following analysis is based on the Therefore, according to the calculation results in Table 6,
original force F, divided by 0.18A to obtain the corrected it can be observed that the corrected yield strength * does
yield stress *, representing the yield strength of a specific not exceed the theoretical strength of solid Ti-6Al-4V
solid strut in the specimen. Equation IV is used to represent printed by the same SLM machine, which is about 1310
the maximum strength borne by a single solid structure: MPa. However, the maximum strength max on the notch
exceeds the theoretical yield strength of 1310 MPa. This
d
σ max = σ ×*( 1 2+ ρ ) (IV) indicates that the material has reached yield at the notch,
initiating plastic deformation and crack propagation,
Volume 1 Issue 2 (2025) 7 doi: 10.36922/ESAM025170009