
Page 83 - ESAM-1-2
P. 83
Engineering Science in
Additive Manufacturing Porous structure performance improvement
rounded, representing structures with rounded corners. to provide environmental protection, preventing reactions
The numerical values, such as 99.5/109.5/119.5 denote between the samples and oxygen during fabrication.
different structural angles. In addition, “65” indicates To ensure that the porosity of the printed sample is
uniform porosity at 65%, and “G” is used for gradient the same as the designed CAD model, the density and the
porosity, 55% – 60% – 65% – 70% – 75%.
weight of the printed sample need to be calculated. Using
The specimens used in this experiment were all printed Equation III, the porosity can be calculated:
using the SolidMEN AM300 printer from the Industrial
Technology Research Institute. To minimize powder waste ρ = (1 − V × ) 100 % (III)
and save time, a resource-based view restriction module V 0
was added to the machine, limiting the size of the build where ρ is the material porosity, V is the material real
platform to 120 mm × 120 mm. This equipment utilizes
SLM technology, and the scanning parameters are set volume, and V is the volume of a cylinder. The primary
0
according to Table 2. The chamfer was filled with argon gas objective of compression testing is to determine the
material’s behavior and mechanical properties under
compression by measuring fundamental variables such
as strength and deformation. The compression test would
be conducted with an Instron 5582 Universal testing
machine (Instron, United States) at an initial strain
rate of 1×10 (s ). To ensure the strain accurately from
−1
−4
the specimen, a linear variable differential transformer
was externally attached at room temperature. During
compression testing, the test specimen was placed between
two platens, and compression was applied using a crosshead
to control displacement. Typically, the specimen would be
shortening along the compression force direction while
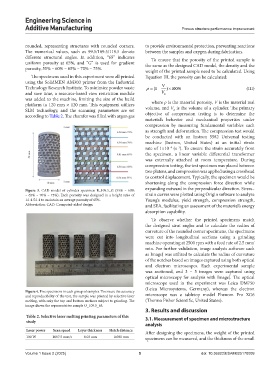
Figure 3. CAD model of cylinder specimen R_109.5_G (55% – 60% expanding outward in the perpendicular direction. Stress–
– 65% – 70% – 75%). Each porosity was designed in a height ratio of strain curves were plotted using Origin software to analyze
1:1:1.5:1:1 to maintain an average porosity of 65%. Young’s modulus, yield strength, compression strength,
Abbreviation: CAD: Computed-aided design. and SEA, facilitating an assessment of the material’s energy
absorption capability.
To observe whether the printed specimens match
the designed strut angles and to calculate the radius of
curvature of the rounded corner specimens, the specimens
were cut into longitudinal sections using a grinding
machine operating at 2500 rpm with a feed rate of 2.5 mm/
min. For further validation, image analysis software such
as ImageJ was utilized to calculate the radius of curvature
of the notches based on images captured using both optical
and electron microscopes. Each experimental sample
was sectioned, and 3 – 5 images were captured using
optical microscopy for analysis with ImageJ. The optical
microscope used in the experiment was Leica DM750
(Leica Microsystems, Germany), whereas the electron
Figure 4. Five specimens in each group of samples. To ensure the accuracy
and reproducibility of the test, the sample was printed by selective laser microscope was a tabletop model Phenom Pro XG6
melting, with only the top and bottom surfaces subject to grinding. The (Thermo Fisher Scientific, United States).
image shows the representative sample O_109.5_65.
3. Results and discussion
Table 2. Selective laser melting printing parameters of this
study 3.1. Measurement of specimen and microstructure
analysis
Laser power Scan speed Layer thickness Hatch distance After designing the specimens, the weight of the printed
100 W 1087.5 mm/s 0.03 mm 0.081 mm specimens can be measured, and the thickness of the small
Volume 1 Issue 2 (2025) 5 doi: 10.36922/ESAM025170009