
Page 57 - ESAM-1-4
P. 57
Engineering Science in
Additive Manufacturing Reusability of Ti6Al4V powder in LPBF
A B
C D
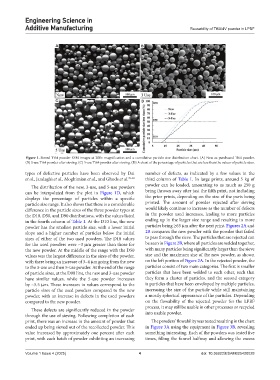
Figure 1. Sieved Ti64 powder SEM images at 200× magnification and a cumulative particle size distribution chart. (A) New as-purchased Ti64 powder.
(B) 3-use Ti64 powder after sieving. (C) 5-use Ti64 powder after sieving. (D) A chart of the percentage of particles that are less than the values of particle sizes.
types of defective particles have been observed by Dai number of defects, as indicated by a few values in the
et al., Jandaghi et al., Moghimian et al., and Ghods et al. 35-38 third column of Table 1. In large prints, around 5 kg of
The distribution of the new, 3-use, and 5-use powders powder can be loaded, amounting to as much as 250 g
can be interpolated from the plot in Figure 1D, which being thrown away after just the fifth print, not including
displays the percentage of particles within a specific the prior prints, depending on the size of the parts being
particle size range. It also shows that there is a considerable printed. The amount of powder rejected after sieving
difference in the particle sizes of the three powder types at would likely continue to increase as the number of defects
the D10, D50, and D90 distributions, with the values listed in the powder used increases, leading to more particles
in the fourth column of Table 1. At the D10 line, the new ending up in the larger size range and resulting in more
powder has the smallest particle size, with a lower initial particles being ≥63 μm after the next print. Figures 2A and
slope and a higher number of particles below the initial 2B compares the new powder with the powder that failed
sizes of either of the two used powders. The D10 values to pass through the sieve. The particles that are rejected can
for the used powders were ~3 μm greater than those for be seen in Figure 2B, where all particles are welded together,
the new powder. At the middle of the range with the D50 with many particles being significantly larger than the sieve
values was the largest difference in the sizes of the powder, size and the maximum size of the new powder, as shown
with there being an increase of 3–4 μm going from the new on the left portion of Figure 2A. In the rejected powder, the
to the 3-use and then 5-use powder. At the end of the range particles consist of two main categories. The first is smaller
of particle sizes, at the D90 line, the new and 3-use powder particles that have been welded to each other, such that
have similar values, while the 5-use powder increases they form a cluster of particles, and the second category
by ~5.5 μm. These increases in values correspond to the is particles that have been enveloped by multiple particles,
particle sizes of the used powders compared to the new increasing the size of the particle while still maintaining
powder, with an increase in defects in the used powders a mostly spherical appearance of the particles. Depending
compared to the new powder. on the flowability of the rejected powder for the LPBF
process, it may still be usable in other processes or recycled
These defects are significantly reduced in the powder
through the use of sieving. Following completion of each into usable powder.
print, there was an increase in the amount of powder that The powders’ flowability was tested resulting in the chart
ended up being sieved out of the recollected powder. This in Figure 3A using the equipment in Figure 3B, revealing
value increased by approximately one percent after each something interesting. Each of the powders was tested five
print, with each batch of powder exhibiting an increasing times, filling the funnel halfway and allowing the excess
Volume 1 Issue 4 (2025) 4 doi: 10.36922/ESAM025420028