
Page 107 - GHES-3-2
P. 107
Global Health Economics and
Sustainability
Association of teleworking with employee well-being
that we have normal distributions in the main variables and interactions, compared to the rest of the sample. The results
do not need to conduct non-parametric tests. The first check are presented in Table 7.
concerned statistical differentiation by gender. In two out The fifth check concerned the statistical differentiation
of the three cases, statistically significant differences were in terms of educational level. In one of the three cases, a
found. Specifically, the women had higher psychosocial statistically significant difference was found. Specifically,
effects and a greater need for social interactions, compared
to the men. This indicates that gender is an important Table 5. Significant age differences
factor when estimating the main variables. The results are
presented in Table 4. N Μ SD p-value
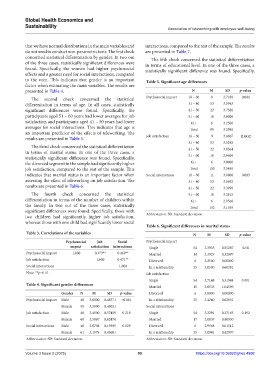
The second check concerned the statistical Psychosocial impact 18 – 30 8 2.7188 0.001
differentiation in terms of age. In all cases, statistically 31 – 40 53 3.0943
significant differences were found. Specifically, the 41 – 50 22 3.7386
participants aged 51 – 60 years had lower averages for job 51 – 60 10 3.9000
satisfaction and participants aged 41 – 50 years had lower 61+ 6 3.2500
averages for social interactions. This indicates that age is Total 99 3.2980
an important predictor of the effects of teleworking. The
results are presented in Table 5. Job satisfaction 18 – 30 9 3.4667 0.002
31 – 40 53 3.5245
The third check concerned the statistical differentiation 41 – 50 22 3.8364
in terms of marital status. In one of the three cases, a
statistically significant difference was found. Specifically, 51 – 60 10 2.9600
the divorced segment in the sample had significantly higher 61+ 6 3.8000
job satisfaction, compared to the rest of the sample. This Total 100 3.5480
indicates that marital status is an important factor when Social interactions 18 – 30 11 3.0808 0.005
assessing the effect of teleworking on job satisfaction. The 31 – 40 53 3.0692
results are presented in Table 6. 41 – 50 22 3.3990
The fourth check concerned the statistical 51 – 60 10 3.2815
differentiation in terms of the number of children within 61+ 6 2.9568
the family. In two out of the three cases, statistically Total 102 3.1558
significant differences were found. Specifically, those with
two children had significantly higher job satisfaction, Abbreviation: SD: Standard deviation.
whereas those with one child had significantly lower social
Table 6. Significant differences in marital status
Table 3. Correlations of the variables N M SD p-value
Psychosocial Job Social Psychosocial impact
impact satisfaction interactions Single 54 3.3935 0.55287 0.56
Psychosocial impact 1.000 0.373** 0.469** Married 14 3.3929 0.32097
Job satisfaction 1.000 0.471** Divorced 6 3.2500 0.00000
Social interactions 1.000 In a relationship 25 3.0500 0.60381
Note: **p<0.01. Job satisfaction
Single 54 3.7148 0.31944 0.001
Table 4. Significant gender differences Married 15 3.0533 1.04599
Gender N Μ SD p-value Divorced 6 3.8000 0.00000
Psychosocial impact Male 40 3.0000 0.48371 <0.001 In a relationship 25 3.4240 0.62801
Female 59 3.5000 0.48021 Social interactions
Job satisfaction Male 40 3.4900 0.57459 0.218 Single 54 3.2291 0.37163 0.192
Female 60 3.5867 0.62476 Married 17 3.0839 0.40930
Social interactions Male 40 3.0704 0.19595 0.029 Divorced 6 2.9568 0.01512
Female 61 3.1979 0.45681 In a relationship 25 3.0941 0.42907
Abbreviation: SD: Standard deviation. Abbreviation: SD: Standard deviation.
Volume 3 Issue 2 (2025) 99 https://doi.org/10.36922/ghes.4998