
Page 108 - GHES-3-2
P. 108
Global Health Economics and
Sustainability
Association of teleworking with employee well-being
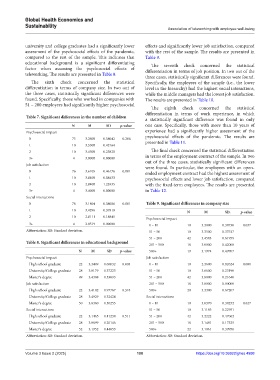
university and college graduates had a significantly lower effects and significantly lower job satisfaction, compared
assessment of the psychosocial effects of the pandemic, with the rest of the sample. The results are presented in
compared to the rest of the sample. This indicates that Table 9.
educational background is a significant differentiating The seventh check concerned the statistical
factor when assessing the psychosocial effects of differentiation in terms of job position. In two out of the
teleworking. The results are presented in Table 8.
three cases, statistically significant differences were found.
The sixth check concerned the statistical Specifically, the employees of the sample (i.e., the lower
differentiation in terms of company size. In two out of level in the hierarchy) had the highest social interactions,
the three cases, statistically significant differences were while the middle managers had the lowest job satisfaction.
found. Specifically, those who worked in companies with The results are presented in Table 10.
51 – 200 employees had significantly higher psychosocial
The eighth check concerned the statistical
differentiation in terms of work experience, in which
Table 7. Significant differences in the number of children
a statistically significant difference was found in only
N M SD p-value one case. Specifically, those with more than 10 years of
Psychosocial impact experience had a significantly higher assessment of the
0 75 3.2600 0.58042 0.206 psychosocial effects of the pandemic. The results are
1 10 3.5500 0.42164 presented in Table 11.
2 10 3.4500 0.25820 The final check concerned the statistical differentiation
3+ 4 3.0000 0.00000 in terms of the employment contract of the sample. In two
Job satisfaction out of the three cases, statistically significant differences
were found. In particular, the employees with an open-
0 76 3.6105 0.46176 0.001 ended employment contract had the highest assessment of
1 10 3.8400 0.08433 psychosocial effects and lower job satisfaction, compared
2 10 2.8400 1.23935 with the fixed-term employees. The results are presented
3+ 4 3.4000 0.00000 in Table 12.
Social interactions
0 78 3.1804 0.38086 0.001 Table 9. Significant differences in company size
1 10 3.4296 0.37819 N M SD. p-value
2 10 2.8111 0.18841 Psychosocial impact
3+ 4 2.8519 0.00000 0 – 10 10 3.3000 0.38730 0.037
Abbreviation: SD: Standard deviation. 11 – 50 10 3.3500 0.33747
51 – 200 42 3.4583 0.61959
Table 8. Significant differences in educational background
201 – 500 18 3.0000 0.42008
N M SD p-value 500+ 19 3.1974 0.49707
Psychosocial impact Job satisfaction
High school graduate 22 3.3409 0.60032 0.003 0 – 10 10 2.3600 0.82624 0.001
University/College graduate 28 3.0179 0.37223 11 – 50 10 3.6600 0.23190
Master’s degree 49 3.4388 0.53893 51 – 200 42 3.8000 0.21640
Job satisfaction 201 – 500 18 3.8000 0.00000
High school graduate 22 3.4182 0.97767 0.318 500+ 20 3.3300 0.67207
University/College graduate 28 3.4929 0.32424 Social interactions
Master’s degree 50 3.6360 0.50255 0 – 10 10 3.0370 0.38252 0.627
Social interactions 11 – 50 10 3.1185 0.22951
High school graduate 22 3.1465 0.41234 0.511 51 – 200 42 3.2222 0.47062
University/College graduate 28 3.0899 0.20146 201 – 500 18 3.1481 0.17325
Master’s degree 52 3.1952 0.44853 500+ 22 3.1061 0.39956
Abbreviation: SD: Standard deviation. Abbreviation: SD: Standard deviation.
Volume 3 Issue 2 (2025) 100 https://doi.org/10.36922/ghes.4998