
Page 13 - GPD-1-2
P. 13
Gene & Protein in Disease DNA methylation and gene expression on rats with protein malnutrition
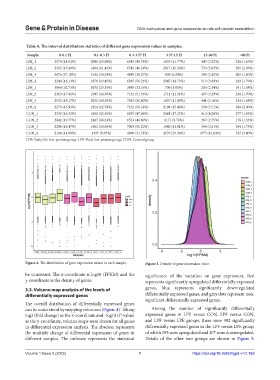
Table 4. The interval distribution statistics of different gene expression values in samples.
Sample 0‑0.1 FI 0.1‑0.3 FI 0.3‑3.57 FI 3.57‑15 FI 15‑60 FI >60 FI
LPE_1 2574 (18.52%) 2096 (15.08%) 6919 (49.79%) 1635 (11.77%) 447 (3.22%) 226 (1.63%)
LPE_2 2315 (15.89%) 1664 (11.42%) 6742 (46.29%) 2817 (19.34%) 733 (5.03%) 295 (2.03%)
LPE_3 3476 (27.18%) 3101 (24.24%) 4895 (38.27%) 805 (6.29%) 309 (2.42%) 205 (1.60%)
LPE_4 2244 (16.13%) 1870 (13.45%) 6985 (50.22%) 2047 (14.72%) 513 (3.69%) 249 (1.79%)
LPF_1 3964 (32.73%) 3071 (25.35%) 3895 (32.16%) 709 (5.85%) 283 (2.34%) 191 (1.58%)
LPF_2 2363 (17.01%) 1995 (14.36%) 7132 (51.33%) 1711 (12.31%) 457 (3.29%) 236 (1.70%)
LPF_3 2532 (18.17%) 2021 (14.50%) 7052 (50.60%) 1657 (11.89%) 441 (3.16%) 234 (1.68%)
LPF_4 2273 (15.93%) 1824 (12.78%) 7162 (50.18%) 2198 (15.40%) 530 (3.71%) 286 (2.00%)
CON_1 2339 (16.32%) 1800 (12.56%) 6835 (47.69%) 2468 (17.22%) 613 (4.28%) 277 (1.93%)
CON_2 2642 (19.77%) 2487 (18.61%) 6523 (48.80%) 1171 (8.76%) 367 (2.75%) 176 (1.32%)
CON_3 2298 (16.47%) 1962 (14.06%) 7003 (50.20%) 1940 (13.91%) 504 (3.61%) 244 (1.75%)
CON_4 2188 (14.00%) 1395 (8.93%) 4960 (31.74%) 4576 (29.28%) 1975 (12.64%) 532 (3.40%)
LPE: Early-life low-protein group, LPF: Fetal low-protein group, CON: Control group
Figure 2. The distribution of gene expression values in each sample. Figure 3. Density of gene expression value.
be consistent. The x-coordinate is log10 (FPKM) and the significance of the variation on gene expression. Red
y-coordinate is the density of genes. represents significantly upregulated differentially expressed
3.3. Volcano map analysis of the levels of genes, blue represents significantly downregulated
differentially expressed genes differentially expressed genes, and gray dots represent non-
significant differentially expressed genes.
The overall distribution of differentially expressed genes
can be understood by mapping volcanoes (Figure 4). Taking Among the number of significantly differentially
log2 (fold change) as the x-coordinate and -log10 (P-value) expressed genes in LPE versus CON, LPF versus CON,
as the y-coordinate, volcano maps were drawn for all genes and LPF versus LPE groups, there were 302 significantly
in differential expression analysis. The abscissa represents differentially expressed genes in the LPF versus LPE group,
the multiple change of differential expression of genes in of which 195 were upregulated and 107 were downregulated.
different samples. The ordinate represents the statistical Details of the other two groups are shown in Figure 5.
Volume 1 Issue 2 (2022) 7 https://doi.org/10.36922/gpd.v1i2.169