
Page 17 - GPD-1-2
P. 17
Gene & Protein in Disease DNA methylation and gene expression on rats with protein malnutrition
A B
C
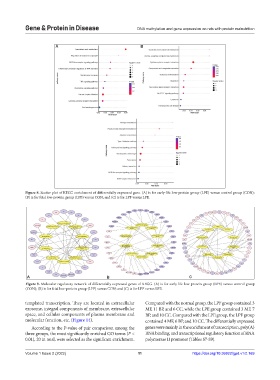
Figure 8. Scatter plot of KEGG enrichment of differentially expressed gene. (A) is for early-life low-protein group (LPE) versus control group (CON);
(B) is for fetal low-protein group (LPF) versus CON; and (C) is for LPF versus LPE.
A B C
Figure 9. Molecular regulatory network of differentially expressed genes of KEGG. (A) is for early-life low-protein group (LPE) versus control group
(CON); (B) is for fetal low-protein group (LPF) versus CON; and (C) is for LPF versus LPE.
templated transcription. They are located in extracellular Compared with the normal group, the LPF group contained 3
exosome, integral components of membrane, extracellular MF, 11 BP, and 6 CC, while the LPE group contained 3 MF, 7
space, and cellular components of plasma membrane and BP, and 10 CC. Compared with the LPE group, the LPF group
molecular function, etc. (Figure 14). contained 4 MF, 6 BP, and 10 CC. The differentially expressed
According to the P-value of pair comparison among the genes were mainly in the enrichment of transcription, poly(A)
three groups, the most significantly enriched GO terms (P < RNA binding, and transcriptional regulatory function of RNA
0.01), 20 in total, were selected as the significant enrichment. polymerase II promoter (Tables S7-S9).
Volume 1 Issue 2 (2022) 11 https://doi.org/10.36922/gpd.v1i2.169