
Page 16 - GPD-1-2
P. 16
Gene & Protein in Disease DNA methylation and gene expression on rats with protein malnutrition
A B
C D
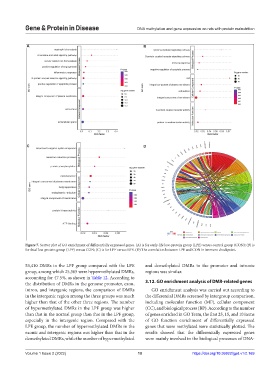
Figure 7. Scatter plot of GO enrichment of differentially expressed genes. (A) is for early-life low-protein group (LPE) versus control group (CON); (B) is
for fetal low-protein group (LPF) versus CON; (C) is for LPF versus LPE. (D) The correlation between LPE and CON in immune checkpoint.
53,410 DMRs in the LPF group compared with the LPE and demethylated DMRs in the promoter and intronic
group, among which 25,365 were hypermethylated DMRs, regions was similar.
accounting for 47.5%, as shown in Table 12. According to
the distribution of DMRs in the genome promoter, exon, 3.12. GO enrichment analysis of DMR-related genes
intron, and intergenic regions, the comparison of DMRs GO enrichment analysis was carried out according to
in the intergenic region among the three groups was much the differential DMRs screened by intergroup comparison,
higher than that of the other three regions. The number including molecular function (MF), cellular component
of hypermethylated DMRs in the LPF group was higher (CC), and biological process (BP). According to the number
than that in the normal group than that in the LPF group, of genes enriched in GO Term, the first 25, 15, and 10 items
especially in the intergenic region. Compared with the of GO function enrichment of differentially expressed
LPE group, the number of hypermethylated DMRs in the genes that were methylated were statistically plotted. The
exonic and intergenic regions was higher than that in the results showed that the differentially expressed genes
demethylated DMRs, while the number of hypermethylated were mainly involved in the biological processes of DNA-
Volume 1 Issue 2 (2022) 10 https://doi.org/10.36922/gpd.v1i2.169