
Page 18 - GPD-1-2
P. 18
Gene & Protein in Disease DNA methylation and gene expression on rats with protein malnutrition
3.13. KEGG pathway enrichment analysis of pathways. The enrichment of differentially expressed genes
differentially methylated genes in 57 pathways in the LPF group was different from that
According to the KEGG annotation, the KEGG pathway in the CON group. The differentially methylated genes
contains the following intermolecular interactions and were mainly involved in endocytosis under the cell process
reaction networks: Metabolism, genetic information category. Differentially methylated genes are mainly
processing, environmental information processing, cellular involved in endocytosis under the cell process category, and
processes, and biological systems. Overall evaluation and in protein processing, spliceosome, and ubiquitin-mediated
pairwise comparison of the three groups showed that proteolytic pathways in the endoplasmic reticulum
differential genes were mainly enriched in the pathways of under the genetic information processing category. The
metabolism and organismal systems (Figure 15). enrichment of differentially expressed genes in 50 pathways
in the LPE group was significantly different from that in the
With a significant enrichment at P < 0.01, the differentially CON group, and more genes were significantly enriched in
expressed genes were mainly enriched in the following endocytosis, protein processing in endoplasmic reticulum,
spliceosome, and cell adhesion molecules (CAMs), which
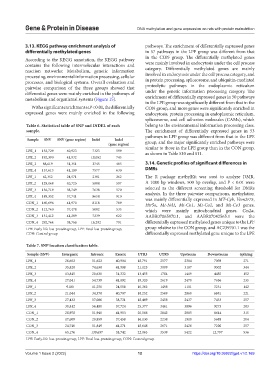
Table 6. Statistical table of SNP and INDEL of each belong to the environmental information processing class.
sample. The enrichment of differentially expressed genes in 53
pathways in LPF group was different from that in the LPE
Sample SNV SNV (gene region) Indel Indel group, and the major significantly enriched pathways were
(gene region)
LPE_1 152,729 40,923 7323 599 similar to those in the LPE group than in the CON group,
as shown in Table S10 and S11.
LPE_2 192,390 41,932 10,052 745
LPE_3 88,619 31,351 3745 403 3.14. Genetic profiles of significant differences in
LPE_4 157,613 41,109 7577 630 DMRs
LPF_1 62,352 24,571 2381 262 The R package methylKit was used to analyze DMR.
LPF_2 128,068 40,725 5884 597 A 1000 bp windows, 500 bp overlap, and P < 0.01 were
LPF_3 156,719 38,749 7638 570 selected as the different screening threshold for DMRs
LPF_4 189,352 57,741 8654 910 analysis. In the three pairwise comparisons, methylation
was mainly differentially expressed in MT-Cyb, Vom2r75,
CON_1 160,696 41,970 8118 709 Htr5a, Mt-Nd1, Mt-Co1, Mt-Co2, and Mt-Co3 genes,
CON_2 112,760 37,478 5082 535 which were mainly mitochondrial genes. Ces2a,
CON_3 151,412 41,289 7239 622 AABR07065970.1, and AABR07042565.1 were the
CON_4 292,764 38,766 16,292 791 differentially expressed methylated genes unique to the LPF
LPE: Early-life low-protein group, LPF: Fetal low-protein group, group relative to the CON group, and AC239701.1 was the
CON: Control group differentially expressed methylated gene unique to the LPE
Table 7. SNP location classification table.
Sample (SNV) Intergenic Intronic Exonic UTR3 UTR5 Upstream Downstream Splicing
LPE_1 26,662 51,622 40,904 18,791 2577 2384 7098 271
LPE_2 35,828 74,638 41,908 21,125 3009 3187 9302 344
LPE_3 13,845 20,630 31,332 13,455 1784 1419 4485 152
LPE_4 27,041 54,739 41,092 19,320 2619 2470 7656 235
LPF_1 9100 11,250 24,558 10,362 1498 1101 3231 142
LPF_2 21,044 34,378 40,707 18,252 2569 2060 6881 221
LPF_3 27,432 57,086 38,731 18,469 2458 2437 7433 257
LPF_4 30,812 56,480 57,724 25,377 3461 3096 9273 283
CON_1 28,978 51,940 41,953 20,566 2842 2885 8644 315
CON_2 17,609 29,859 37,458 16,130 2238 1910 5688 204
CON_3 24,740 51,849 41,271 18,648 2671 2426 7220 257
CON_4 65,176 139,697 38,742 22,063 3539 5422 12,797 536
LPE: Early-life low-protein group, LPF: Fetal low-protein group, CON: Control group
Volume 1 Issue 2 (2022) 12 https://doi.org/10.36922/gpd.v1i2.169