
Page 20 - GPD-1-2
P. 20
Gene & Protein in Disease DNA methylation and gene expression on rats with protein malnutrition
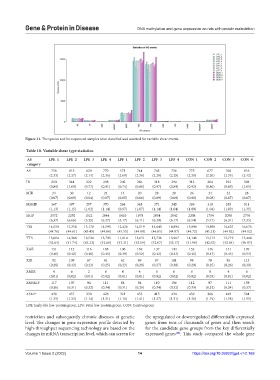
Figure 11. The species and its sequenced samples were classified and counted for variable shear events.
Table 10. Variable shear type statistics.
AS_ LPE_1 LPE_2 LPE_3 LPE_4 LPF_1 LPF_2 LPF_3 LPF_4 CON_1 CON_2 CON_3 CON_4
category
AE 756 815 620 770 571 744 743 756 775 677 768 916
(2.33) (2.37) (2.14) (2.36) (2.09) (2.30) (2.28) (2.28) (2.30) (2.20) (2.35) (2.42)
IR 290 344 222 298 202 286 318 294 312 264 292 398
(0.89) (1.00) (0.77) (0.91) (0.74) (0.88) (0.97) (0.89) (0.92) (0.86) (0.89) (1.05)
MIR 24 30 12 24 14 20 28 28 26 24 24 28
(0.07) (0.09) (0.04) (0.07) (0.05) (0.06) (0.09) (0.08) (0.08) (0.08) (0.07) (0.07)
MSKIP 367 397 297 370 264 345 371 345 369 319 355 511
(1.13) (1.15) (1.02) (1.14) (0.97) (1.07) (1.14) (1.04) (1.09) (1.04) (1.09) (1.35)
SKIP 2072 2292 1522 2044 1410 1978 2054 2042 2208 1754 2058 2776
(6.37) (6.66) (5.25) (6.27) (5.17) (6.11) (6.29) (6.17) (6.54) (5.71) (6.31) (7.35)
TSS 14,550 15,358 13,170 14,593 12,426 14,519 14,645 14,894 15,098 13,898 14,625 16,676
(44.76) (44.61) (45.45) (44.80) (45.55) (44.88) (44.85) (44.97) (44.72) (45.21) (44.82) (44.12)
TTS 13,664 14,368 12,526 13,703 11,814 13,651 13,736 13,967 14,146 13,113 13,719 15,448
(42.04) (41.74) (43.23) (42.06) (43.31) (42.19) (42.07) (42.17) (41.90) (42.65) (42.04) (40.87)
XAE 131 143 116 148 106 169 137 144 152 146 141 199
(0.40) (0.42) (0.40) (0.45) (0.39) (0.52) (0.42) (0.43) (0.45) (0.47) (0.43) (0.53)
XIR 92 109 67 81 62 89 87 101 98 78 85 113
(0.28) (0.32) (0.23) (0.25) (0.23) (0.28) (0.27) (0.30) (0.29) (0.25) (0.26) (0.30)
XMIR 4 6 2 6 4 4 6 6 6 8 4 6
(0.01) (0.02) (0.01) (0.02) (0.01) (0.01) (0.02) (0.02) (0.02) (0.03) (0.01) (0.02)
XMSKIP 117 107 94 111 84 94 110 106 112 97 111 139
(0.36) (0.31) (0.32) (0.34) (0.31) (0.29) (0.34) (0.32) (0.33) (0.32) (0.34) (0.37)
XSKIP 438 457 330 428 321 455 415 434 459 366 449 584
(1.35) (1.33) (1.14) (1.31) (1.18) (1.41) (1.27) (1.31) (1.36) (1.19) (1.38) (1.55)
LPE: Early-life low-protein group, LPF: Fetal low-protein group, CON: Control group
restriction and subsequently chronic diseases at genetic the upregulated or downregulated differentially expressed
level. The changes in gene expression profile detected by genes from tens of thousands of genes and then search
high-throughput sequencing technology are based on the for the candidate gene groups from the key differentially
[28]
changes in mRNA transcription level, which can screen for expressed genes . This study compared the whole gene
Volume 1 Issue 2 (2022) 14 https://doi.org/10.36922/gpd.v1i2.169