
Page 15 - GPD-1-2
P. 15
Gene & Protein in Disease DNA methylation and gene expression on rats with protein malnutrition
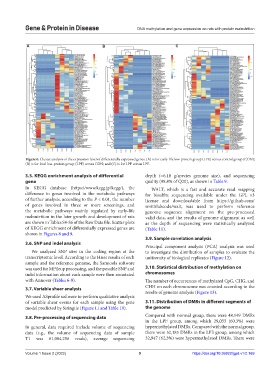
A B C
Figure 6. Cluster analysis of the expression level of differentially expressed genes. (A) is for early-life low-protein group (LPE) versus control group (CON);
(B) is for fetal low-protein group (LPF) versus CON; and (C) is for LPF versus LPE.
3.5. KEGG enrichment analysis of differential depth (=6.10 g/species genome size), and sequencing
gene quality (98.8% of Q20), as shown in Table 9.
In KEGG database (https://www.kegg.jp/kegg/), the WALT, which is a fast and accurate read mapping
difference in genes involved in the metabolic pathways for bisulfite sequencing available under the GPL v3
of further analysis, according to the P < 0.01, the number license and downloadable from https://github.com/
of genes involved in three or more screenings, and smithlabcode/walt, was used to perform reference
the metabolic pathways mainly regulated by early-life genome sequence alignment on the pre-processed
malnutrition in the later growth and development of rats valid data, and the results of genome alignment as well
are shown in Tables S4-S6 of the Raw Data file. Scatter plots as the depth of sequencing were statistically analyzed
of KEGG enrichment of differentially expressed genes are (Table 11).
shown in Figures 8 and 9.
3.9. Sample correlation analysis
3.6. SNP and indel analysis
Principal component analysis (PCA) analysis was used
We analyzed SNP sites in the coding region at the to investigate the distribution of samples to evaluate the
transcriptomic level. According to the Hisat results of each uniformity of biological replicates (Figure 12).
sample and the reference genome, the Samtools software
was used for MPileup processing, and the possible SNP and 3.10. Statistical distribution of methylation on
indel information about each sample were then annotated chromosomes
with Annovar (Tables 6-9). The number of occurrences of methylated CpG, CHG, and
3.7. Variable shear analysis CHH on each chromosome was counted according to the
results of genome analysis (Figure 13).
We used ASprofile software to perform qualitative analysis
of variable shear events for each sample using the gene 3.11. Distribution of DMRs in different segments of
model predicted by Stringtie (Figure 11 and Table 10). the genome
3.8. Pre-processing of sequencing data Compared with normal group, there were 48,149 DMRs
in the LPF group, among which 29,033 (60.3%) were
In general, data required include volume of sequencing hypermethylated DMRs. Compared with the normal group,
data (e.g., the volume of sequencing data of sample there were 52,185 DMRs in the LPE group, among which
T1 was 61,004,256 reads), average sequencing 32,947 (62.3%) were hypermethylated DMRs. There were
Volume 1 Issue 2 (2022) 9 https://doi.org/10.36922/gpd.v1i2.169