
Page 19 - GPD-1-2
P. 19
Gene & Protein in Disease DNA methylation and gene expression on rats with protein malnutrition
Table 8. Indel location classification table.
Sample (indel) Intergenic Intronic Exonic UTR3 UTR5 Upstream Downstream Splicing
LPE_1 1509 2774 591 1480 122 152 566 38
LPE_2 2125 4111 738 1775 147 203 779 42
LPE_3 734 1068 399 968 65 89 341 22
LPE_4 1577 2897 624 1483 117 147 573 41
LPF_1 467 549 260 704 52 58 228 16
LPF_2 1188 1810 592 1362 115 140 538 33
LPF_3 1560 3148 566 1388 115 140 568 35
LPF_4 1734 3078 902 1740 146 201 691 38
CON_1 1751 2741 700 1752 156 178 685 40
CON_2 999 1631 529 1155 104 105 450 27
CON_3 1456 2770 613 1396 126 144 604 39
CON_4 4132 7109 781 2229 217 362 1159 54
LPE: Early-life low-protein group, LPF: Fetal low-protein group, CON: Control group
Table 9. Quality pre‑processing of sequencing data.
Sample Raw data Valid data Q20% Q30% GC%
Base Base
CON-1 7.75G 6.19G 98.59 96.6 22.72
CON-2 6.14G 4.95G 98.63 96.69 22.45
CON-3 8.14G 5.60G 98.45 96.19 22.7
CON-4 9.56G 5.68G 98.24 95.69 22.6
LPE-1 9.19G 6.20G 98.69 96.81 22.47
LPE-2 8.36G 5.80G 98.7 96.84 22.39
LPE-3 11.57G 6.40G 98.5 96.39 23.54
LPE-4 6.84G 5.35G 98.6 96.62 23.51
LPF-1 13.07G 5.60G 98.51 96.38 23.42
LPF-2 8.74G 6.04G 98.62 96.66 23.08
LPF-3 10.28G 5.82G 98.59 96.59 23.24
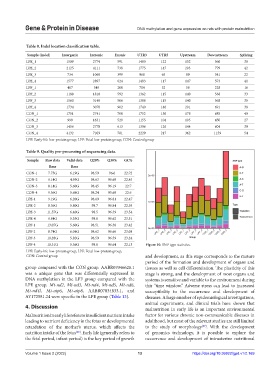
LPF-4 10.31G 5.56G 98.6 96.64 22.13 Figure 10. SNP type statistics.
LPE: Early-life low-protein group, LPF: Fetal low-protein group,
CON: Control group and development, as this stage corresponds to the mature
period of the formation and development of organs and
group compared with the CON group. AABR07046628.1 tissues as well as cell differentiation. The plasticity of this
was a unique gene that was differentially expressed in stage is strong, and the development of most organs and
DNA methylation in the LPF group compared with the systems is sensitive and variable to the environment during
LPE group. Mt-nd2, Mt-nd3, Mt-nd4, Mt-nd5, Mt-nd6, this “time window.” Adverse stress can lead to increased
Mt-nd4l, Mt-atp6, Mt-atp8, AABR07034833.1, and susceptibility to the occurrence and development of
AY172581.24 were specific in the LPE group (Table 13). diseases. A large number of epidemiological investigations,
animal experiments, and clinical trials have shown that
4. Discussion malnutrition in early life is an important environmental
Malnutrition in early life refers to insufficient nutrient intake factor for various chronic non-communicable diseases in
leading to nutrient deficiency in the fetus or developmental adulthood, but most of the relevant studies are still limited
retardation of the mother’s uterus, which affects the to the study of morphology . With the development
[27]
nutrition intake of the fetus . Early life (generally refers to of genomics technology, it is possible to explore the
[26]
the fetal period, infant period) is the key period of growth occurrence and development of intrauterine nutritional
Volume 1 Issue 2 (2022) 13 https://doi.org/10.36922/gpd.v1i2.169