
Page 21 - GPD-1-2
P. 21
Gene & Protein in Disease DNA methylation and gene expression on rats with protein malnutrition
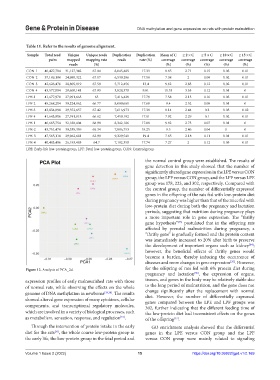
Table 11. Refer to the results of genome alignment.
Sample Total read Unique Unique reads Duplication Duplication Mean of C ≥ 2 × C ≥ 5 × C ≥ 10 × C ≥ 15 × C
pairs mapped mapping rate reads rate (%) coverage coverage coverage coverage coverage
reads (%) (%) (%) (%) (%) (%)
CON-1 46,427,704 31,127,342 67.04 8,045,485 17.33 8.85 2.71 0.15 0.03 0.01
CON-2 37,189,180 24,980,322 67.17 6,539,296 17.58 7.38 2 0.09 0.02 0.01
CON-3 42,626,476 28,805,019 67.58 5,712,456 13.4 9.62 2.85 0.12 0.02 0.01
CON-4 43,577,094 29,600,141 67.93 3,928,370 9.01 11.33 3.55 0.12 0.01 0
LPF-1 41,677,970 27,091,665 65 7,416,428 17.79 7.58 2.15 0.16 0.03 0.01
LPF-2 45,268,204 30,224,062 66.77 8,009,661 17.69 9.4 2.52 0.08 0.01 0
LPF-3 43,834,898 29,552,657 67.42 7,616,973 17.38 8.14 2.44 0.2 0.05 0.02
LPF-4 41,643,906 27,741,918 66.62 7,459,192 17.91 7.92 2.29 0.1 0.02 0.01
LPE-1 46,665,754 32,188,404 68.98 8,342,186 17.88 9.82 2.75 0.07 0.01 0
LPE-2 43,751,478 30,338,359 69.34 7,986,753 18.25 9.5 2.46 0.04 0 0
LPE-3 47,565,118 29,962,681 62.99 9,229,541 19.4 7.65 2.18 0.11 0.01 0.01
LPE-4 40,483,496 26,193,485 64.7 7,182,350 17.74 7.27 2 0.12 0.03 0.01
LPE: Early-life low-protein group, LPF: Fetal low-protein group, CON: Control group
the normal control group were established. The results of
gene detection in this study showed that the number of
significantly altered gene expression in the LPE versus CON
group, the LPF versus CON group, and the LPF versus LPE
group was 178, 223, and 302, respectively. Compared with
the control group, the number of differentially expressed
genes in the offspring of the rats fed with low-protein diet
during pregnancy was higher than that of the mice fed with
low-protein diet during both the pregnancy and lactation
periods, suggesting that nutrition during pregnancy plays
a more important role in gene expression. The “thrifty
gene hypothesis” postulated that in the offspring rats
[33]
affected by prenatal malnutrition during pregnancy, a
“thrifty gene” is gradually formed and the protein content
was immediately increased to 20% after birth to preserve
the development of important organs such as kidney ;
[34]
however, the beneficial effects of thrifty genes would
become a burden, thereby inducing the occurrence of
diseases and more changes in gene expression . However,
[35]
Figure 12. Analysis of PCA_2d. for the offspring of rats fed with 6% protein diet during
pregnancy and lactation , the expression of organs,
[36]
expression profiles of early malnourished rats with those tissues, and genes in the body may be relatively stable due
of normal rats, while observing the effects on the whole to the long period of malnutrition, and the gene does not
genome of DNA methylation in newborns [29,30] . The results change significantly after the replacement with normal
showed altered gene expression of many cytokines, cellular diet. However, the number of differentially expressed
genes compared between the LPE and LPF groups was
components, and transcriptional regulatory molecules, 302, further indicating that the different feeding time of
which are involved in a variety of biological processes, such the low-protein diet had inconsistent effects on the genes
as metabolism, sensation, response, and regulation . of the offspring .
[31]
[37]
Through the intervention of protein intake in the early GO enrichment analysis showed that the differential
diet for the rats , the whole course low-protein group in genes in the LPE versus CON group and the LPF
[32]
the early life, the low-protein group in the fetal period and versus CON group were mainly related to signaling
Volume 1 Issue 2 (2022) 15 https://doi.org/10.36922/gpd.v1i2.169