
Page 26 - GPD-1-2
P. 26
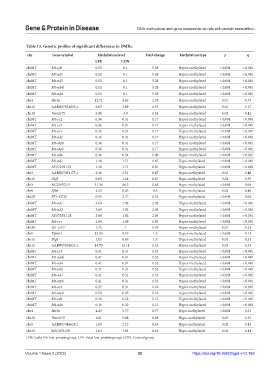
Gene & Protein in Disease                      DNA methylation and gene expression on rats with protein malnutrition


            Table 13. Genetic profiles of significant differences in DMRs.
             chr       Gene symbol         Methylation level   Fold‑change   Methylation type   p         q
                                          LPE        CON
            chrMT      Mt-cyb             0.52       0.1          5.28       Hyper-methylated  < 0.001  < 0.001
            chrMT      Mt-nd5             0.52       0.1          5.28       Hyper-methylated  < 0.001  < 0.001
            chrMT      Mt-nd3             0.52       0.1          5.28       Hyper-methylated  < 0.001  < 0.001
            chrMT      Mt-nd4l            0.52       0.1          5.28       Hyper-methylated  < 0.001  < 0.001
            chrMT      Mt-nd4             0.52       0.1          5.28       Hyper-methylated  < 0.001  < 0.001
            chr4       Htr5a             12.71       4.63         2.74       Hyper-methylated  0.01      0.37
            chr12      AABR07034833.1     6.67       3.89         1.72       Hyper-methylated  0.01      0.17
            chr18      Vom2r75            5.88       3.9          1.51       Hyper-methylated  0.02      0.42
            chrMT      Mt-co2             0.36       0.31         1.17       Hyper-methylated  < 0.001  < 0.001
            chrMT      Mt-co3             0.36       0.31         1.17       Hyper-methylated  < 0.001  < 0.001
            chrMT      Mt-co1             0.36       0.31         1.17       Hyper-methylated  < 0.001  < 0.001
            chrMT      Mt-nd2             0.36       0.31         1.17       Hyper-methylated  < 0.001  < 0.001
            chrMT      Mt-atp8            0.36       0.31         1.17       Hyper-methylated  < 0.001  < 0.001
            chrMT      Mt-atp6            0.36       0.31         1.17       Hyper-methylated  < 0.001  < 0.001
            chrMT      Mt-nd6             0.36       0.34         1.06       Hyper-methylated  < 0.001  < 0.001
            chrMT      Mt-nd1             1.48       1.71         0.87       Hypo-methylated  < 0.001   < 0.001
            chrMT      AY172581.24        1.48       1.71         0.87       Hypo-methylated  < 0.001   < 0.001
            chr3       AABR07051177.1     2.36       3.51         0.67       Hypo-methylated   0.03      0.48
            chr15      Dlg5               0.69       1.04         0.67       Hypo-methylated   0.04      0.55
            chrY       AC239701.1        31.56       48.5         0.65       Hypo-methylated  < 0.001    0.04
            chr9       Efhb               3.23       6.43         0.5        Hypo-methylated   0.03      0.48
            chr20      RT1-CE10           0.95       2.77         0.34       Hypo-methylated  < 0.001    0.02
            chrMT      Mt-nd1             3.69       1.82         2.03       Hyper-methylated  < 0.001  < 0.001
            chrMT      Mt-nd2             3.69       1.82         2.03       Hyper-methylated  < 0.001  < 0.001
            chrMT      AY172581.24        3.69       1.82         2.03       Hyper-methylated  < 0.001  < 0.001
            chrMT      Mt-co1             2.84       1.48         1.92       Hyper-methylated  < 0.001  < 0.001
            chr20      Rt1-ce10           1.75        1           1.76       Hyper-methylated  0.01      0.21
            chr5       Tipinl1           12.83       8.55         1.5        Hyper-methylated  < 0.001   0.11
            chr15      Dlg5               1.03       0.69         1.5        Hyper-methylated  0.04      0.53
            chr12      AABR07034833.1    14.75       11.11        1.33       Hyper-methylated  0.02      0.33
            chrMT      Mt-co3             0.41       0.31         1.32       Hyper-methylated  < 0.001  < 0.001
            chrMT      Mt-nd4l            0.41       0.31         1.32       Hyper-methylated  < 0.001  < 0.001
            chrMT      Mt-nd4             0.41       0.31         1.32       Hyper-methylated  < 0.001  < 0.001
            chrMT      Mt-nd5             0.41       0.31         1.32       Hyper-methylated  < 0.001  < 0.001
            chrMT      Mt-nd3             0.41       0.31         1.32       Hyper-methylated  < 0.001  < 0.001
            chrMT      Mt-atp6            0.41       0.31         1.32       Hyper-methylated  < 0.001  < 0.001
            chrMT      Mt-co2             0.37       0.31         1.22       Hyper-methylated  < 0.001  < 0.001
            chrMT      Mt-atp8            0.52       0.45         1.16       Hyper-methylated  < 0.001  < 0.001
            chrMT      Mt-cyb             0.36       0.32         1.13       Hyper-methylated  < 0.001  < 0.001
            chrMT      Mt-nd6             0.36       0.32         1.13       Hyper-methylated  < 0.001  < 0.001
            chr4       Htr5a              4.43       5.77         0.77       Hypo-methylated  < 0.001    0.23
            chr18      Vom2r75            4.01       5.88         0.68       Hypo-methylated   0.05      0.55
            chr5       AABR07046628.1     1.09       2.23         0.49       Hypo-methylated   0.02      0.44
            chr19      LOC679149          1.64       3.64         0.45       Hypo-methylated   0.02      0.41
            LPE: Early-life low-protein group, LPF: Fetal low-protein group, CON: Control group


            Volume 1 Issue 2 (2022)                         20                     https://doi.org/10.36922/gpd.v1i2.169