
Page 86 - GPD-2-4
P. 86
Gene & Protein in Disease Gene polymorphism and chronic kidney disease
a 3-mL peripheral blood sample was obtained from all Forward: 5’-CAT TGC AAT CCC AAA GAC CCA
study participants in an EDTA vial. The blood samples CTC -3’
were stored at −20℃ in a refrigerator until DNA isolation. Reverse: 5’-TTG GTT TTG TGG GCA ACA TGA TGG-3’
Clinical parameters associated with the CCR2 SNP were The PCR conditions were as follows: an initial denaturation
assessed, including a complete blood count, serum levels of step at 94℃ for 5 min, followed by 33 cycles of denaturation
urea, creatinine, blood urea nitrogen, calcium, phosphorus, at 94℃ for 30 s, annealing at 56℃ for 30 s, extension at 72℃
sodium, potassium, and uric acid. In addition, spot urine for 30 s, with a final extension at 72℃ for 5 min. Cycling
samples were collected for microalbumin and creatinine conditions were standardized on a conventional PCR machine
analysis. Radiological investigations, such as ultrasound, (T100 Thermal cycler, Bio-Rad Laboratories, Inc, India).
were conducted to assess kidney size.
After successful amplification, the 173-bp PCR products of
2.2. Sample size the CCR2 gene were subjected to RFLP. RFLP digestion was
performed in a 20-µL reaction mixture containing 2.5 U of
The sample size was calculated based on the odds ratio BseJI (BsaBI) restriction enzyme (Thermo Fisher Scientific,
(OR) of the dominant A allele of CCR2 in developing Vilnius, Lithuania) and incubated at 65℃ for 2 h. The
ESRD in the study population using Equation I :
[17]
digested products were examined and visualized using a gel
2 documentation system (UVP DigiDoc-It Drawer, Analytik
z + z ) 1 1 p −
− p
n = ( α β 1 + 2 (I) Jena GmbH + Co. KG, Germany) followed by 3% agarose gel
( −1 e )ln 2 p 1 p 2 electrophoresis. The undigested PCR product with 173 bp
represented the G allele. The presence of the A allele was
Where p = 1/OR (OR = 32.4) and p = 1.0 (the standard confirmed by visualizing two fragments of the digested PCR
2
1
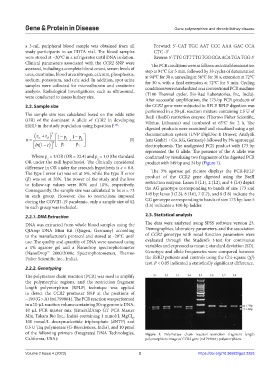
OR under the null hypothesis). The clinically considered product with 149 bp and 24 bp (Figure 1).
difference in OR under the research hypothesis is e = 0.8.
The type I error (α) was set at 5%, while the type II error The 3% agarose gel picture displays the PCR-RFLP
(β) was set at 20%. The power of the study and the loss product of the CCR2 gene digested using the BseJI
to follow-up values were 80% and 10%, respectively. restriction enzyme. Lanes 1 (L1), 2 (L2), and 4 (L4) depict
Consequently, the sample size was calculated to be n = 73 the AG genotype corresponding to bands of size 173 and
in each group. However, due to restrictions imposed 149 bp; lanes 3 (L3), 6 (L6), 7 (L7), and 8 (L8) indicate the
during the COVID-19 pandemic, only a sample size of 62 GG genotype corresponding to bands of size 173 bp; lane 5
in each group was included. (L5) indicates a 100-bp ladder.
2.2.1. DNA Extraction 2.3. Statistical analysis
DNA was extracted from whole blood samples using the The data were analyzed using SPSS software version 23.
QIAmp DNA Mini Kit (Qiagen, Germany) according Demographics, laboratory parameters, and the association
to the manufacturer’s protocol and stored at -20°C until of CCR2 genotype with renal function parameters were
use. The quality and quantity of DNA were assessed using evaluated through the Student’s t-test for continuous
a 1% agarose gel and a Nanodrop spectrophotometer variables and expressed as mean ± standard deviation (SD).
(NanoDrop™ 2000/2000c Spectrophotometers, Thermo Genotype and allele frequencies were compared between
2
Fisher Scientific Inc., India). the ESRD patients and controls using the Chi-square (χ )
test. P < 0.05 indicated a statistically significant difference.
2.2.2. Genotyping
The polymerase chain reaction (PCR) was used to amplify
the polymorphic regions, and the restriction fragment
length polymorphism (RFLP) technique was applied
to detect the CCR2 promoter SNP at the positions of
−190 (G > A) (rs1799864). The PCR reaction was performed
in a 20-µL reaction volume containing 50 ng genomic DNA,
10 µL PCR master mix (EmeraldAmp GT PCR Master
Mix, Takara Bio Inc., India) containing 1 mmol/L MgCl ,
2
100 mmol/L deoxynucleotide triphosphate (dNTP) and
0.5 U Taq polymerase (G-Biosciences, India), and 10 pmol
of the following primers (Integrated DNA Technologies, Figure 1. Polymerase chain reaction-restriction fragment length
California, USA): polymorphism image of CCR2 gene (rs1799864) polymorphism.
Volume 2 Issue 4 (2023) 3 https://doi.org/10.36922/gpd.2253