
Page 118 - GTM-4-3
P. 118
Global Translational Medicine Rapid diagnostic imaging on biopsy needle
testing was conducted using both ex vivo porcine tissue and additional biopsies were left uncompressed for 2 min
a murine tumor model. Fresh CNBs were obtained from before fixation in 10% neutral-buffered formalin for 72 h.
ex vivo porcine tissue, and the murine tumor FVB/N-Tg A calibrated scale was integrated into the CoreView
(TgMMTV-neu) mouse strain was used as a representative fixture for murine biopsies, enhancing precision in
model for human mammary tumors obtained from the determining biopsy compression levels. This scale was
Cancer Vaccine Institute in Seattle, Washington, using designed based on the average height of a 14-gauge
14-gauge needles. A total of approximately 20 samples were CNB (1.2 mm) and featured black notches spaced at
analyzed for each tissue type across different compression 50 µm increments. In the murine model, biopsies were
levels. compressed to 70%, 60%, 50%, and 40% of their original
For porcine tissue, biopsy thickness was measured thickness. Before compression, these biopsies were stained
on the biopsy gun using a caliper before compression. with Hoechst and Rhodamine B solutions for 30 s, followed
To prevent tissue dehydration, biopsies were showered by rinsing with PBS. CNBs were then loaded onto the
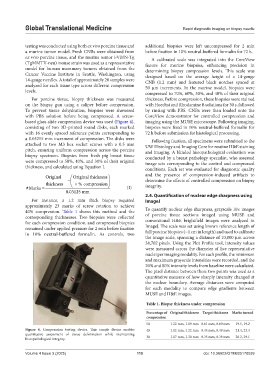
with PBS solution before being compressed. A screw- CoreView demonstrator for controlled compression and
based glass-slide compression device was used (Figure 4), imaging using the MUSE microscope. Following imaging,
consisting of two 3D-printed round disks, each marked biopsies were fixed in 10% neutral-buffered formalin for
with 16 evenly spaced reference points corresponding to 72 h before submission for histological processing.
a 0.03215 mm increment of compression. The disks were Following fixation, all specimens were submitted to the
attached to two M3 hex socket screws with a 0.5 mm UW Histology and Imaging Core for routine H&E staining
pitch, ensuring uniform compression across the porcine and imaging. A blinded histopathological evaluation was
biopsy specimen. Biopsies from fresh pig breast tissue conducted by a breast pathology specialist, who assessed
were compressed to 50%, 40%, and 30% of their original image sets corresponding to the control and compressed
thickness, and calculated using Equation I. conditions. Each set was evaluated for diagnostic quality
Original Original thickness and the presence of compression-induced artifacts to
thickness − % compression× determine the effects of controlled compression on biopsy
#Marks = (I) integrity.
0.03125 mm
2.4. Quantification of nuclear edge sharpness using
For instance, a 1.2 mm thick biopsy required ImageJ
approximately 23 marks of screw rotation to achieve
40% compression. Table 1 shows this method and the To quantify nuclear edge sharpness, grayscale 10× images
corresponding thicknesses. Two biopsies were collected of porcine tissue sections imaged using MUSE and
for each compression condition, and compressed biopsies conventional H&E brightfield images were analyzed in
remained under applied pressure for 2 min before fixation ImageJ. The scale was set using known reference length of
in 10% neutral-buffered formalin. As controls, two full porcine biopsies (~1 cm in length) and used to calibrate
the image scale, spanning a distance of 10,000 µm across
38,702 pixels. Using the Plot Profile tool, intensity values
were measured across the diameter of five representative
nuclei per imaging modality. For each profile, the minimum
and maximum grayscale intensities were recorded, and the
20% and 80% intensity levels from baseline were calculated.
The pixel distance between these two points was used as a
quantitative measure of how sharply intensity changed at
the nuclear boundary. Average distances were computed
for each modality to compare edge gradients between
MUSE and H&E images.
Table 1. Biopsy thickness under compression
Percentage of Original thickness Target thickness Marks turned
compression
50 1.22 mm, 1.19 mm 0.61 mm, 0.60 mm 19.5, 19.2
Figure 4. Compression testing device. This simple device enables 40 1.12 mm, 1.22 mm 0.45 mm, 0.49 mm 21.4, 23.4
quantitative assessment of tissue deformation while maintaining
histopathological integrity. 30 1.17 mm, 1.30 mm 0.35 mm, 0.39 mm 26.2, 29.1
Volume 4 Issue 3 (2025) 110 doi: 10.36922/GTM025170039