
Page 122 - GTM-4-3
P. 122
Global Translational Medicine Rapid diagnostic imaging on biopsy needle
A B
C
D
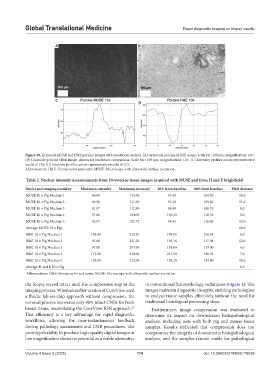
Figure 10. Grayscale MUSE and H&E porcine images with resolution analysis. (A) Grayscale porcine MUSE image. Scale bar: 100 µm; magnification: 10×,
(B) Grayscale porcine H&E image, shown for resolution comparison. Scale bar: 100 µm; magnification: 10×, (C) Intensity profiles across representative
nuclei of (A); (D) Intensity profiles across representative nuclei of (B).
Abbreviations: H&E: Hematoxylin and eosin; MUSE: Microscopy with ultraviolet surface excitation.
Table 2. Nuclear intensity measurements from 10×porcine tissue images acquired with MUSE and from H and E brightfield
Nuclei and imaging modality Minimum intensity Maximum intensity 20% from baseline 80% from baseline Pixel distance
MUSE 10 × Pig Nucleus 1 86.00 115.00 91.80 109.20 10.0
MUSE 10 × Pig Nucleus 2 86.50 111.00 91.50 109.20 11.0
MUSE 10 × Pig Nucleus 3 81.87 112.90 88.08 106.70 8.0
MUSE 10 × Pig Nucleus 4 97.00 124.09 102.40 118.70 9.0
MUSE 10 × Pig Nucleus 5 92.97 122.72 98.92 116.80 12.0
Average MUSE 10 × Pig 10.0
H&E 10 × Pig Nucleus 1 145.00 212.40 198.92 158.48 6.0
H&E 10 × Pig Nucleus 2 91.00 221.20 195.16 117.04 12.0
H&E 10 × Pig Nucleus 3 97.00 207.00 185.00 119.00 6.0
H&E 10 × Pig Nucleus 4 115.90 240.00 215.20 140.70 7.0
H&E 10 × Pig Nucleus 5 128.00 212.00 195.20 144.80 10.0
Average H and E 10 × Pig 8.2
Abbreviations: H&E: Hematoxylin and eosin; MUSE: Microscopy with ultraviolet surface excitation.
the biopsy stayed intact until the compression step in the to conventional histopathology techniques (Figure 1). The
imaging process. When an earlier version of CoreView used images maintain diagnostic integrity, enabling pathologists
a fluidic lab-on-chip approach without compression, the to analyze tissue samples effectively without the need for
removal process recovered only 90% intact CNBs for fresh traditional histological processing steps.
breast tissue, necessitating the CoreView ION approach. Furthermore, image compression was evaluated to
25
This efficiency is a key advantage for rapid diagnostic determine its impact on downstream histopathological
workflows, allowing for near-instantaneous feedback analysis, including tests with both pig and mouse tissue
during pathology assessments and CNB procedures. The samples. Results indicated that compression does not
prototype’s ability to produce high-quality digital images at compromise the integrity of downstream histopathological
low magnification shows its potential as a viable alternative analysis, and the samples remain viable for pathological
Volume 4 Issue 3 (2025) 114 doi: 10.36922/GTM025170039