
Page 75 - IJAMD-2-3
P. 75
International Journal of AI for
Materials and Design Optimization of membrane shrinkage and stability
(vi) Step 6: Pareto front construction XGBT exhibit high prediction accuracy, as evidenced by the
The feasible samples are mapped onto a Pareto front close alignment of predicted values with the ideal diagonal
by jointly considering two competing objectives: line on both training and test sets, indicating strong
Shrinkage deviation from the target values and the generalization capability across varying input conditions.
predicted CIW (robustness). This multi-objective The ANN, DTR, and LR models display noticeably larger
optimization framework enables the identification of deviations from the ground truth, suggesting the presence
trade-offs between dimensional accuracy and process of underfitting, model bias, or limited capacity to capture
stability, guiding informed decision-making rather the complex, non-linear relationships inherent in the
than relying on a single metric. dataset. Notably, certain predicted %RD values correspond
(vii) Step 7: Optimal parameter selection. to multiple experimentally observed outcomes. This
Based on the Pareto front constructed in Step 6, phenomenon does not originate from predictive ambiguity
the optimal processing configuration is selected by in the models but rather reflects the intrinsic instability of
prioritizing the lowest CIW to maximize stability while the electrospinning process itself. The shrinkage ratios are
maintaining an acceptable deviation from the target susceptible to fluctuations arising from subtle variations
shrinkage ratios, ensuring dimensional precision. in ambient environment, equipment status, and material
This integrated approach effectively balances product heterogeneity, all of which can introduce non-negligible
quality with manufacturing consistency, providing noise into the output. Such variability highlights the
a practical and reliable processing window for necessity of incorporating both accuracy and stability
electrospinning applications. into the modeling framework to ensure reliable shrinkage
control.
3. Results and discussion
Figure 3 presents the performance of six machine
3.1. Shrinkage ratio prediction model learning models in predicting %TD, including RF, SVR,
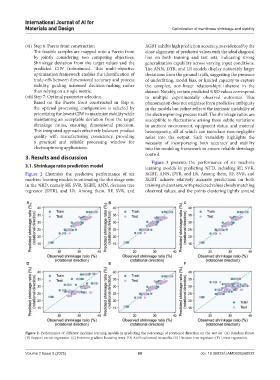
Figure 2 illustrates the predictive performance of six XGBT, ANN, DTR, and LR. Among them, RF, SVR, and
machine learning models in estimating the shrinkage ratio XGBT achieve relatively accurate predictions on both
in the %RD, namely RF, SVR, XGBT, ANN, decision tree training and test sets, with predicted values closely matching
regressor (DTR), and LR. Among them, RF, SVR, and observed values, and the points clustering tightly around
A B C
D E F
Figure 2. Performance of different machine learning models in predicting the percentage of rotational direction on the test set. (A) Random forest.
(B) Support vector regression. (C) Extreme gradient boosting trees. (D) Artificial neural networks. (E) Decision tree regressor; (F) Linear regression.
Volume 2 Issue 3 (2025) 69 doi: 10.36922/IJAMD025260022