
Page 79 - IJAMD-2-3
P. 79
International Journal of AI for
Materials and Design Optimization of membrane shrinkage and stability
lowest values in MSE and RMSE, confirming its superior indicate the directionality of influence; in other words, they
accuracy and robustness in modeling TD stability. In do not reveal whether an increase in a given parameter
contrast, the ANN and LR models yield significantly higher enhances or diminishes stability. Applied voltage and TPU
errors, indicating poor predictive reliability. Overall, the concentration consistently rank as the most influential
results indicate that XGBT is the most effective model for factors in both RD and TD stability models, underscoring
predicting %RD stability and %TD stability, outperforming their critical role in governing shrinkage stability during
other approaches in both accuracy and robustness. electrospinning. Voltage controls the electrostatic field
strength, directly influencing jet acceleration, elongation,
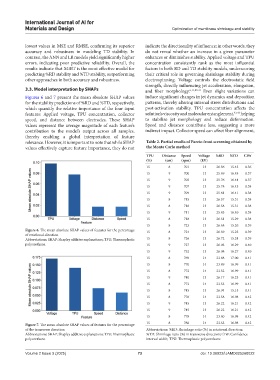
3.3. Model interpretation by SHAPs and fiber morphology. 6,11,39-41 Even slight variations can
Figures 6 and 7 present the mean absolute SHAP values induce significant changes in jet dynamics and deposition
for the stability predictions of %RD and %TD, respectively, patterns, thereby altering internal stress distributions and
which quantify the relative importance of the four input post-activation stability. TPU concentration affects the
features: Applied voltage, TPU concentration, collector solution’s viscosity and molecular entanglement, 42,43 helping
speed, and distance between electrodes. These SHAP to stabilize jet morphology and reduce deformation.
values represent the average magnitude of each feature’s Speed and distance contribute less, suggesting a more
contribution to the model’s output across all samples, indirect impact. Collector speed can affect fiber alignment,
thereby enabling a global interpretation of feature
relevance. However, it is important to note that while SHAP Table 2. Partial results of Pareto front screening obtained by
values effectively capture feature importance, they do not the Monte Carlo method
TPU Distance Speed Voltage %RD %TD CIW
(%) (cm) (rpm) (kV)
15 8 701 13 26.36 15.43 0.36
15 9 700 13 25.69 16.48 0.37
15 9 705 13 25.76 16.44 0.37
15 9 707 13 25.78 16.43 0.38
15 9 709 13 25.81 16.41 0.38
15 8 715 13 26.57 15.31 0.38
15 8 716 13 26.58 15.31 0.38
15 9 711 13 25.83 16.40 0.38
15 8 718 13 26.61 15.29 0.38
15 8 723 13 26.68 15.26 0.39
Figure 6. The mean absolute SHAP values of features for the percentage 15 8 724 13 26.69 15.25 0.39
of rotational direction
Abbreviations: SHAP: Shapley additive explanations; TPU: Thermoplastic 15 8 726 13 26.72 15.24 0.39
polyurethane. 15 9 727 13 26.03 16.29 0.40
15 9 732 13 26.08 16.27 0.40
15 8 769 14 23.48 17.00 0.41
15 8 770 14 23.49 16.99 0.41
15 8 772 14 23.52 16.99 0.41
15 9 740 13 26.17 16.23 0.41
15 8 773 14 23.53 16.99 0.41
15 8 745 13 26.94 15.15 0.41
15 8 776 14 23.58 16.98 0.42
15 9 745 13 26.22 16.21 0.42
15 9 745 13 26.22 16.21 0.42
15 8 778 14 23.60 16.98 0.42
Figure 7. The mean absolute SHAP values of features for the percentage 15 8 780 14 23.63 16.98 0.42
of the transverse direction Abbreviations: %RD: Shrinkage ratio (%) in rotational direction;
Abbreviations: SHAP: Shapley additive explanations; TPU: Thermoplastic %TD: Shrinkage ratio (%) in transverse direction; CIW: Confidence
polyurethane. interval width; TPU: Thermoplastic polyurethane.
Volume 2 Issue 3 (2025) 73 doi: 10.36922/IJAMD025260022