
Page 80 - IJAMD-2-3
P. 80
International Journal of AI for
Materials and Design Optimization of membrane shrinkage and stability
potentially influencing %RD more than %TD. Distance with the minimum combined CIW was selected as the
influences jet flight time and solvent evaporation, but optimal condition. This approach enables simultaneous
its effect appears less consistent. Although SHAP values optimization of shrinkage accuracy and process robustness
cannot reveal directional effects, the results highlight in electrospinning.
voltage and polymer concentration as key parameters for Table 2 presents a subset of process conditions
controlling shape stability.
generated via Monte Carlo simulation and screened using
3.4. Monte Carlo simulation-based optimization the shrinkage prediction model to meet the target values
of %RD = 25% ± 2% and %TD = 15% ± 2%. Although all
In electrospinning, required shrinkage ratios (%RD and candidates fall within the target range, their predicted CIW
%TD) vary across applications. To enable customized vary from 0.36 to 0.42. The combination with the lowest
control of target shrinkage while maximizing process CIW (TPU = 15%, distance = 8 cm, speed = 701 rpm,
stability, we developed a process optimization framework voltage = 13 kV) shows the highest predicted stability,
that combines shrinkage prediction and stability prediction indicating reduced sensitivity to process variability while
models. Using %RD = 25% and %TD = 15% with maintaining the desired shrinkage levels.
a ± 2% tolerance as a representative case to demonstrate
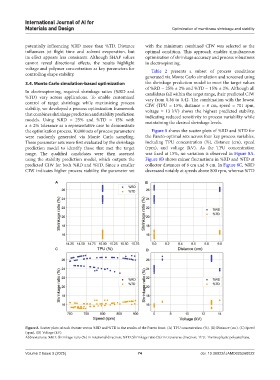
the optimization process, 10,000 sets of process parameters Figure 8 shows the scatter plots of %RD and %TD for
were randomly generated via Monte Carlo sampling. the Pareto-optimal sets across four key process variables,
These parameter sets were first evaluated by the shrinkage including TPU concentration (%), distance (cm), speed
prediction model to identify those that met the target (rpm), and voltage (kV). As the TPU concentration
range. The qualified candidates were then assessed was fixed at 15%, no variation is observed in Figure 8A.
using the stability prediction model, which outputs the Figure 8B shows minor fluctuations in %RD and %TD at
predicted CIW for both %RD and %TD. Since a smaller collector distances of 8 cm and 9 cm. In Figure 8C, %RD
CIW indicates higher process stability, the parameter set decreased notably at speeds above 800 rpm, whereas %TD
A B
C D
Figure 8. Scatter plots of each feature versus %RD and %TD in the results of the Pareto front. (A) TPU concentration (%). (B) Distance (cm). (C) Speed
(rpm). (D) Voltage (kV).
Abbreviations: %RD: Shrinkage ratio (%) in rotational direction; %TD: Shrinkage ratio (%) in transverse direction; TPU: Thermoplastic polyurethane.
Volume 2 Issue 3 (2025) 74 doi: 10.36922/IJAMD025260022