
Page 77 - IJAMD-2-3
P. 77
International Journal of AI for
Materials and Design Optimization of membrane shrinkage and stability
the smallest RMSE (2.00), the highest R (0.75), and a deposition heterogeneity, which were not included in the
2
relatively low MAPE (7.35). In contrast, the RF, XGBT, model inputs.
and DTR models exhibit higher prediction errors in %TD
forecasting. The ANN and LR models perform poorly 3.2. Shrinkage stability prediction model
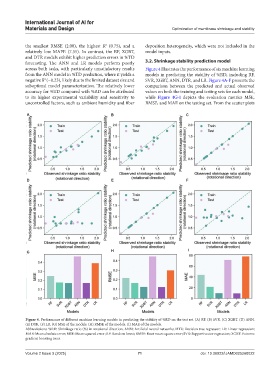
across both tasks, with particularly unsatisfactory results Figure 4 illustrates the performance of six machine learning
from the ANN model in %TD prediction, where it yields a models in predicting the stability of %RD, including RF,
2
negative R (−0.23), likely due to the limited dataset size and SVR, XGBT, ANN, DTR, and LR. Figure 4A-F presents the
suboptimal model parameterization. The relatively lower comparison between the predicted and actual observed
accuracy for %TD compared with %RD can be attributed values on both the training and testing sets for each model,
to its higher experimental variability and sensitivity to while Figure 4G-I depicts the evaluation metrics MSE,
uncontrolled factors, such as ambient humidity and fiber RMSE, and MAE on the testing set. From the scatter plots
A B C
D E F
G H I
Figure 4. Performance of different machine learning models in predicting the stability of %RD on the test set. (A) RF. (B) SVR. (C) XGBT. (D) ANN.
(E) DTR. (F) LR. (G) MSE of the models. (H) RMSE of the models. (I) MAE of the models.
Abbreviations: %RD: Shrinkage ratio (%) in rotational direction; ANN: Artificial neural networks; DTR: Decision tree regressor; LR: Linear regression;
MAE: Mean absolute error; MSE: Mean squared error; RF: Random forest; RMSE: Root mean square error; SVR: Support vector regression; XGBT: Extreme
gradient boosting trees.
Volume 2 Issue 3 (2025) 71 doi: 10.36922/IJAMD025260022