
Page 78 - IJAMD-2-3
P. 78
International Journal of AI for
Materials and Design Optimization of membrane shrinkage and stability
(Figure 4A-F), it is evident that the XGBT and DTR models RF, SVR, XGBT, ANN, DTR, and LR. The fitting plots
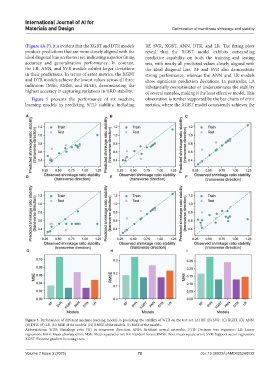
produce predictions that are more closely aligned with the reveal that the XGBT model exhibits outstanding
ideal diagonal line on the test set, indicating superior fitting predictive capability on both the training and testing
accuracy and generalization performance. In contrast, sets, with nearly all predicted values closely aligned with
the LR, ANN, and SVR models exhibit larger deviations the ideal diagonal line. RF and SVR also demonstrate
in their predictions. In terms of error metrics, the XGBT strong performance, whereas the ANN and LR models
and DTR models achieve the lowest values across all three show significant prediction deviations. In particular, LR
indicators (MSE, RMSE, and MAE), demonstrating the substantially overestimates or underestimates the stability
highest accuracy in capturing variations in %RD stability. of several samples, making it the least effective model. This
Figure 5 presents the performance of six machine observation is further supported by the bar charts of error
learning models in predicting %TD stability, including metrics, where the XGBT model consistently achieves the
A B C
D E F
G H I
Figure 5. Performance of different machine learning models in predicting the stability of %TD on the test set. (A) RF. (B) SVR. (C) XGBT. (D) ANN.
(E) DTR. (F) LR. (G) MSE of the models. (H) RMSE of the models. (I) MAE of the models.
Abbreviations: %TD: Shrinkage ratio (%) in transverse direction; ANN: Artificial neural networks; DTR: Decision tree regressor; LR: Linear
regression; MAE: Mean absolute error; MSE: Mean squared error; RF: Random forest; RMSE: Root mean square error; SVR: Support vector regression;
XGBT: Extreme gradient boosting trees.
Volume 2 Issue 3 (2025) 72 doi: 10.36922/IJAMD025260022