
Page 76 - IJAMD-2-3
P. 76
International Journal of AI for
Materials and Design Optimization of membrane shrinkage and stability
A B C
D E F
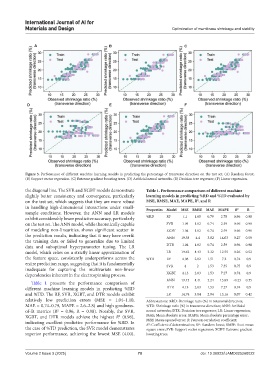
Figure 3. Performance of different machine learning models in predicting the percentage of transverse direction on the test set. (A) Random forest.
(B) Support vector regression. (C) Extreme gradient boosting trees. (D) Artificial neural networks. (E) Decision tree regressor; (F) Linear regression.
the diagonal line. The SVR and XGBT models demonstrate Table 1. Performance comparison of different machine
slightly better consistency and convergence, particularly learning models in predicting %RD and %TD evaluated by
2
on the test set, which suggests that they are more robust MSE, RMSE, MAE, MAPE, R , and R
in handling high-dimensional interactions under small- Properties Model MSE RMSE MAE MAPE R 2 R
sample conditions. However, the ANN and LR models
exhibit considerably lower predictive accuracy, particularly %RD RF 1.1 1.05 0.79 2.78 0.96 0.98
on the test set. The ANN model, while theoretically capable SVR 1.04 1.02 0.74 2.59 0.96 0.98
of modeling non-linearities, shows significant scatter in XGBT 1.04 1.02 0.74 2.59 0.96 0.98
the prediction results, indicating that it may have overfit ANN 19.38 4.4 3.82 14.03 0.27 0.59
the training data or failed to generalize due to limited
data and suboptimal hyperparameter tuning. The LR DTR 1.04 1.02 0.74 2.59 0.96 0.98
model, which relies on a strictly linear approximation of LR 19.62 4.43 3.32 12.55 0.26 0.52
the feature space, consistently underperforms across the %TD RF 4.08 2.02 1.51 7.2 0.74 0.9
entire prediction range, suggesting that it is fundamentally SVR 4 2 1.53 7.35 0.75 0.9
inadequate for capturing the multivariate non-linear
dependencies inherent in the electrospinning process. XGBT 4.13 2.03 1.53 7.27 0.74 0.9
ANN 19.45 4.41 3.24 13.89 -0.23 0.35
Table 1 presents the performance comparison of
different machine learning models in predicting %RD DTR 4.13 2.03 1.53 7.27 0.74 0.9
and %TD. The RF, SVR, XGBT, and DTR models exhibit LR 14.74 3.84 2.94 13.16 0.07 0.42
relatively low prediction errors (MSE = 1.04–1.10, Abbreviations: %RD: Shrinkage ratio (%) in rotational direction;
MAE = 0.74–0.79, MAPE = 2.6–2.8) and high goodness- %TD: Shrinkage ratio (%) in transverse direction; ANN: Artificial
of-fit metrics (R = 0.96, R = 0.98). Notably, the SVR, neural networks; DTR: Decision tree regressor; LR: Linear regression;
2
XGBT, and DTR models achieve the highest R (0.96), MAE: Mean absolute error; MAPE: Mean absolute percentage error;
2
indicating excellent predictive performance for %RD. In MSE: Mean squared error; R: Pearson correlation coefficient;
2
R : Coefficient of determination; RF: Random forest; RMSE: Root mean
the case of %TD prediction, the SVR model demonstrates square error; SVR: Support vector regression; XGBT: Extreme gradient
superior performance, achieving the lowest MSE (4.00), boosting trees.
Volume 2 Issue 3 (2025) 70 doi: 10.36922/IJAMD025260022