
Page 337 - IJB-10-1
P. 337
International Journal of Bioprinting 3D-printed bone scaffolds and biofilm formation
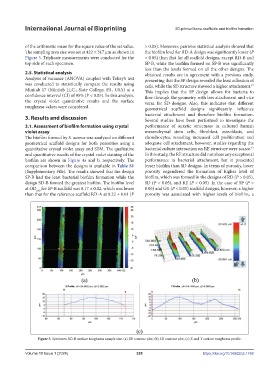
of the arithmetic mean for the square value of the set value. > 0.05). Moreover, pairwise statistical analysis showed that
The sampling area size was set at 422 × 317 µm as shown in the biofilm level for RD-A design was significantly lower (P
Figure 3. Triplicate measurements were conducted for the < 0.05) than that for all scaffold designs, except RD-B and
top side of each specimen. SP-B, while the biofilm formed on SP-B was significantly
less than the levels formed on all the other designs. The
2.5. Statistical analysis obtained results are in agreement with a previous study,
Analysis of variance (ANOVA) coupled with Tukey’s test presenting that the SP design revealed the least adhesion of
was conducted to statistically compare the results using cells, while the SD structure showed a higher attachment.
42
Minitab 17 (Minitab LLC., State College, PA, USA) at a This implies that the SP design allows for bacteria to
confidence interval (CI) of 95% (P < 0.05). In this analysis, flow through the geometry with less attachment and vice
the crystal violet quantitative results and the surface versa for SD designs. Also, this indicates that different
roughness values were considered. geometrical scaffold designs significantly influence
bacterial attachment and therefore biofilm formation.
3. Results and discussion Several studies have been performed to investigate the
3.1. Assessment of biofilm formation using crystal performance of auxetic structures in cultured human
violet assay mesenchymal stem cells, fibroblast, osteoblasts, and
The biofilm formed by S. aureus was analyzed on different chondrocytes, revealing increased cell proliferation and
geometrical scaffold designs for both porosities using a adequate cell attachment; however, studies regarding the
quantitative crystal violet assay and SEM. The qualitative bacterial culture interaction on RE structure were scarce.
43
and quantitative results of the crystal violet staining of the In this study, the RE structure did not show any exceptional
biofilm are shown in Figure 4a and b, respectively. The performance in bacterial attachment, but it presented
comparison between the designs is available in Table S1 lesser biofilm than SD designs. In terms of porosity, lower
(Supplementary File). The results showed that the design porosity engendered the formation of higher level of
SP-B had the least bacterial biofilm formation while the biofilm, which was formed in the designs of RD (P > 0.05),
design SD-B formed the greatest biofilm. The biofilm level SD (P < 0.05), and RE (P < 0.05). In the case of SP (P <
at OD for SP-B scaffold was 0.17 ± 0.02, which was lower 0.05) and GY (P < 0.05) scaffold designs, however, a higher
630
than that for the reference scaffold RD-A at 0.22 ± 0.01 (P porosity was associated with higher levels of biofilm, a
Figure 3. Specimen RD-B surface roughness sample size. (a) 2D contour plot; (b) 3D contour plot; (c) X and Y surface roughness profile.
Volume 10 Issue 1 (2024) 329 https://doi.org/10.36922/ijb.1768