
Page 340 - IJB-10-1
P. 340
International Journal of Bioprinting 3D-printed bone scaffolds and biofilm formation
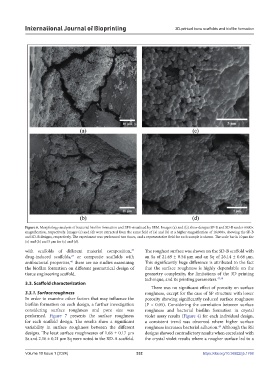
Figure 6. Morphology analysis of bacterial biofilm formation and EPS visualized by SEM. Images (a) and (b) show designs SP-B and SD-B under 6000×
magnification, respectively. Images (c) and (d) were extracted from the same field of (a) and (b) at a higher magnification of 16,000×, showing the SP-B
and SD-B designs, respectively. The experiment was performed two times, and a representative field for each sample is shown. The scale bar is 10 µm for
(a) and (b) and 5 µm for (c) and (d).
with scaffolds of different material composition, The roughest surface was shown on the SD-B scaffold with
37
drug-induced scaffolds, or composite scaffolds with an Sa of 21.69 ± 0.54 µm and an Sq of 26.14 ± 0.68 µm.
27
antibacterial properties, there are no studies examining This significantly huge difference is attributed to the fact
46
the biofilm formation on different geometrical design of that the surface roughness is highly dependable on the
tissue engineering scaffold. geometry complexity, the limitations of the 3D printing
technique, and its printing parameters. 47,48
3.3. Scaffold characterization
There was no significant effect of porosity on surface
3.3.1. Surface roughness roughness, except for the case of SP structure with lower
In order to examine other factors that may influence the porosity showing significantly reduced surface roughness
biofilm formation on each design, a further investigation (P < 0.05). Considering the correlation between surface
considering surface roughness and pore size was roughness and bacterial biofilm formation in crystal
performed. Figure 7 presents the surface roughness violet assay results (Figure 4) for each individual design,
for each scaffold design. The results show a significant a consistent trend was observed where higher surface
variability in surface roughness between the different roughness increases bacterial adhesion. Although the RE
49
designs. The least surface roughnesses of 1.68 ± 0.17 µm designs showed contradictory results when correlated with
Sa and 2.16 ± 0.21 µm Sq were noted in the RD-A scaffold. the crystal violet results where a rougher surface led to a
Volume 10 Issue 1 (2024) 332 https://doi.org/10.36922/ijb.1768