
Page 339 - IJB-10-1
P. 339
International Journal of Bioprinting 3D-printed bone scaffolds and biofilm formation
finding consistent with the notion that higher porosity of blank counterparts. Additionally, the images, which
fiber web-like structures promotes bacterial growth. The encapsulate the field of each scaffold, show that bacterial
44
contrasting results obtained in this study may stem from attachment was more conspicuous at the deep corners of
the geometrical differences, such as wider gaps, enclosed the structure, with the SD-B burdened with higher bacteria
gaps, and entrapment features. In line with findings from growth than the SP-B design. To assess the levels of the
45
other studies using tissue culture, we postulate that biofilm formation between these two designs, two other
the porosity should be balanced in order to achieve the magnification levels were applied as shown in Figure 6. At
optimum attachment. the lower magnification, the clusters of S. aureus appear
more bonded in the SD-B design (Figure 6b) compared to
3.2. Morphological analysis of bacteria the SP-B design (Figure 6a). At the greater magnification,
Both SP-B and SD-B designs, with the lowest and the the EPS was visualized in both designs, but its content was
highest crystal violet values, respectively, were subject to significantly higher in SD-B design. This indicates that
morphological analysis of bacteria conducted by means there was more biofilm formed in the SD-B design, which
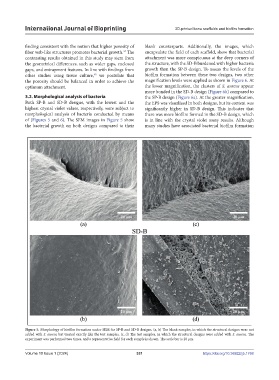
of (Figures 5 and 6). The SEM images in Figure 5 show is in line with the crystal violet assay results. Although
the bacterial growth on both designs compared to their many studies have associated bacterial biofilm formation
Figure 5. Morphology of biofilm formation under SEM for SP-B and SD-B designs. (a, b) The blank samples, in which the structural designs were not
added with S. aureus but treated exactly like the test samples. (c, d) The test samples, in which the structural designs were added with S. aureus. The
experiment was performed two times, and a representative field for each sample is shown. The scale bar is 20 µm.
Volume 10 Issue 1 (2024) 331 https://doi.org/10.36922/ijb.1768