
Page 44 - IJB-2-2
P. 44
Colony development of laser printed eukaryotic (yeast and microalga) microorganisms in co-culture
scope (LSM 700 with 4 laser lines) with an inverted partly “empty”.
stage. A 10X lens and the “tile stacking” function were The results could be analysed by applying the ex-
used to observe the development of the colonies. A ponential growth model, normally applied to cell
laser excitation wavelength of 555 nm was used to populations [17] to the entire micro-colonies. The lag
observe C. vulgaris cells and micro-colonies. period lasted approximately three days for both mi-
Image analysis was performed using the ImageJ croorganisms. Growth took place both within and out-
software (http://rsb.info.nih.gov/ij/). The area of the side of the initial droplet. Once the droplets were
colonies was measured by classical image processing “full”, growth continued on the external radius. From
operations: day 9 onwards, the colonies started to come into con-
conversion to binary using the threshold value tact with one another and growth could no longer be
obtained by the moments method considered unrestricted. It appeared that C. vulgaris
hole filling dominated S. bayanus—maybe thanks to the CO 2 pro-
pixel size calibration vided by the yeast. In a photo-bioreactor containing
particle analysis defined medium with glucose (10 g/L), photosynthesis
3. Results over heterotrophic growth was privileged by C. vul-
garis (data not shown). In this study the plates were lit
S. bayanus and C. vulgaris micro-colonies could be so it is possible that C. vulgaris grew photosyntheti-
easily distinguished by using the natural fluorescence cally while S. bayanus grew heterotrophically.
of chlorophyll (emission peak at 668 nm) (Figure 2). Growth of the two organisms was followed by
After this initial identification, the growth of the mi- measuring the surface areas and radii of their colonies
cro-colonies could be easily followed by daily obser- (Figure 4). Following growth by colony radius meas-
vation of the colonies (Figure 3). This required image urement, S. bayanus started to grow first but then rea-
analysis (Figure 4) could take into account the amount ched the stationary phase before C. vulgaris (Figure 5).
of biomass present in each droplet, especially during Following colony growth with surface density (area),
the early stages of growth while the droplets were S. bayanus started growing a day later than C. vulgaris
but reached almost the same extent of growth as C.
vulgaris (Figure 6). C. vulgaris colonies were bigger
at the end of the experiment. This was not due to the
darker colour of the C. vulgaris colonies, as image
analysis was performed in such a way as to take this
into consideration (Figure 4). Growth of S. bayanus
peaked between 3 to 7 days (Figure 6); C. vulgaris
exhibited its fastest growth rate between 2–6 days
(Figure 6). The order of growth for the two organisms
suggests that C. vulgaris benefited from the presence
of S. bayanus possibly due to the local production of
CO 2.
Despite the fact that the growth rate of S. bayanus
was faster than that of C. vulgaris (Figure 7), the in-
ternal part of each colony (droplet) was completely
occupied within 6 days for C. vulgaris and 7 days for
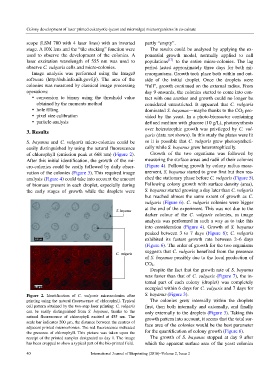
Figure 2. Identification of C. vulgaris microcolonies after S. bayanus (Figure 3).
printing using the natural fluorescence of chlorophyll. Typical The colonies grew internally within the droplets
cell pattern obtained by the two-step laser printing: C. vulgaris first, then both internally and externally, and finally
can be easily distinguished from S. bayanus, thanks to the only externally to the droplets (Figure 3). Taking this
natural fluorescence of chlorophyll excited at 455 nm. The growth pattern into account, it seems that the total sur-
scale bar indicates 200 µm, the distance between the centres of
adjacent printed microcolonies. The red fluorescence indicated face area of the colonies would be the best parameter
the presence of chlorophyll. This picture was taken upon the for the quantification of colony growth (Figure 6).
receipt of the printed samples designated as day 1. The image The growth of S. bayanus stopped at day 9 after
has been cropped to show a typical part of the bio-printed field. which the apparent surface area of the yeast colonies
40 International Journal of Bioprinting (2016)–Volume 2, Issue 2